Figures & data
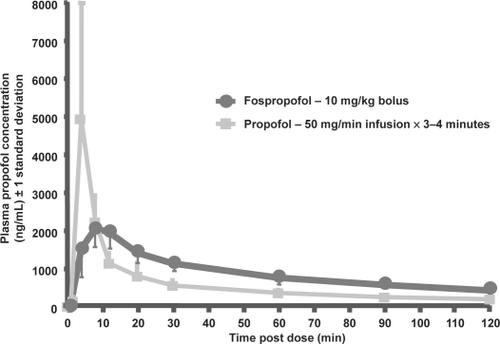
Figure 1 Metabolism of fospropofol.
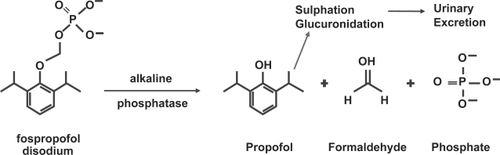
Figure 2 Mean (±1 SD) plasma propofol concentration after 10 mg/kg bolus dose of fospropofol vs 50 mg/min infusion of propofol x 3–4 minutes in 12 healthy subjects. Reprinted with permission from CitationShah A, Fechner J, Struys M, et al 2007. Differential PK/PD of propofol after intravenous fospropofol and diprivan in healthy subjects.Anesthesiology, 107:A46.