Figures & data
Figure 1 Patient disposition.
Figure 1a (upper) Time remaining on treatment. Kaplan-Meier curves estimating the probability of remaining in the study for patients treated with olanzapine or quetiapine.
Figure 1b (lower) Reasons for discontinuation. “Other” includes discontinuations due to patient incarceration.
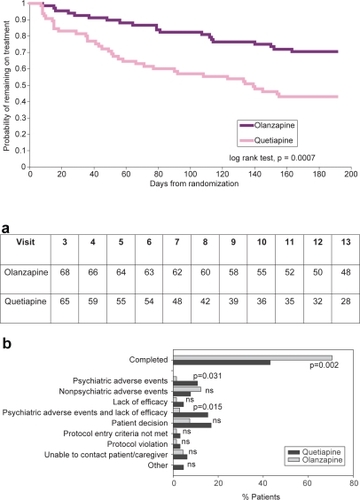
Figure 2 Time remaining relapse free. Kaplan-Meier curves estimating the probability of remaining relapse free for patients treated with olanzapine or quetiapine.
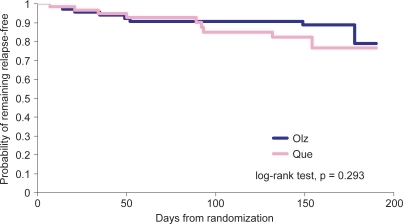
Table 1 Relapse rate by treatment group
Figure 3 Repeated measures analysis of changes in PANSS Total Score. Least-squares means (LSMEANS) for changes in PANSS from baseline to each scheduled visit estimated with a MMRM model that included terms for investigator, drug, PANSS baseline score, visit-by-baseline score and visit-by-drug interactions.
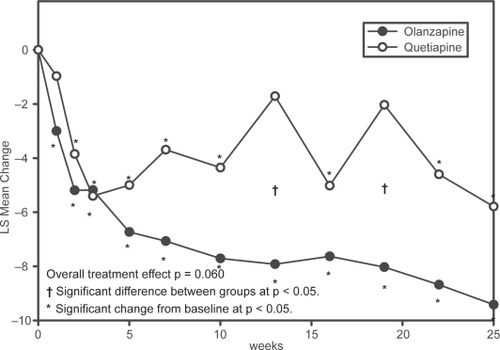
Figure 4 Changes in BMI and weight.
Figure 4a (upper) Repeated measures analysis of weight changes. Least-squares means (LSMEANS) for changes in weight (kg) from baseline to each scheduled visit estimated with MMRM model that includes terms for investigator, drug, baseline weight, visit-by-baseline score and visit-by-drug interactions. The vertical error bars indicate LSMEANS standard error.
Figure 4b (lower) Repeated measures analysis of changes in BMI. Least-squares means (LSMEANS) for changes in BMI (kg/m2) from baseline to each scheduled visit estimated with MMRM model that included terms for investigator, drug, baseline BMI, visit-by-baseline score, and visit-by-drug interactions. The vertical error bars indicate LSMEANS standard error.
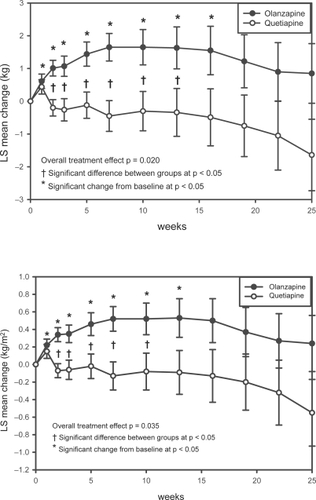
Table 2 LOCF analysis of weight, BMI, and metabolic laboratory parameters