Figures & data
Table 1 The Montreal classification of Crohn’s diseaseCitation5
Figure 1 Comparison of response and remission rates for three pivotal studies for natalizumab in moderate to severely active Crohn’s disease (P = 0.05 and P = 0.12 in ENACT-1, P < 0.001 and P = 0.002 in ENCORE and P < 0.001 and P = 0.003 in ENACT-2 for response and remission respectively).
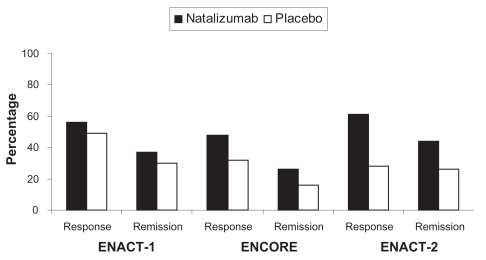
Table 2 “TOUCH” program questionnaire