Figures & data
Table 1 Comparison of linear and nonlinear algorithms in 312 low-to-high-risk patients presenting in the emergency department with chest pain and assessed risk of AMI > 7%. All subjects had ECGs recorded, follow-up completed, and no paced rhythms. The defined arrhythmic death outcomes are expressed as true or false predictions (T or F) by positive or negative algorithmic tests (P or N). The same edited N-N data set was used for the comparative algorithmic analyses
Table 2 Subgroup comparison of algorithms using the relative risk (REL) statistic. All subjects had ECGs recorded and follow-up completed (N = 312). Rejections of noisy N-N data were the same as in , and these rejections included all cases of atrial fibrillation and high arrhythmia rate Table Footnotea. The arrhythmic death outcomes were expressed as true or false predictions (T or F) by positive or negative tests (P or N), and then the REL was determinedTable Footnoteb
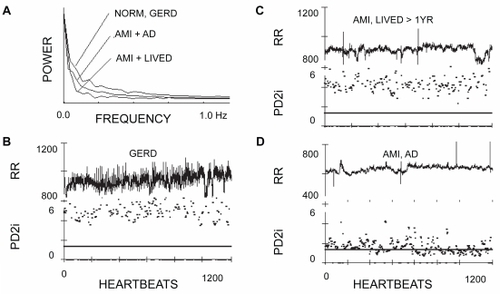
Figure 1 Power spectra, R-R intervals, and associated PD2is of three representative patients. A) The power apectra of the edited heartbeats (N-N) is shown for a normal patient with gastroesophageal reflex disorder (GERD), a patient with an acute myocardial infarction (AMI) who lived for at least the one year of follow-up (LIVED) and a patient with a matched AMI who died of arrhythmic death (AD) after discharge. B) The R-Rs (unedited) and the corresponding PD2is of the GERD patient. C) The R-Rs (unedited) and corresponding PD2is of the AMI, LIVED patient. D) The R-Rs (unedited) and corresponding PD2is of the AMI, AD patient.
Abbreviations: AD, arrhythmic death; AMI, acute myocardial infarction; GERD, gastroesophageal reflux disorder; LIVED, lived for at least one year of follow-up; NORM, normal patient; PD2i, point correlation dimensions.