Figures & data
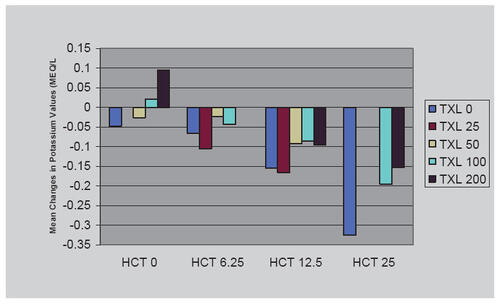
Figure 1 Mean metoprolol plasma concentration versus time curve after administration of the fixed combination tablet and the free combination of metoprolol succinate ER (1 × 95 mg) and HCT (1 × 12.5 mg) in a fasting (n = 48) and fed state (fixed; n = 48, free; n = 47): Study D4026C00005.
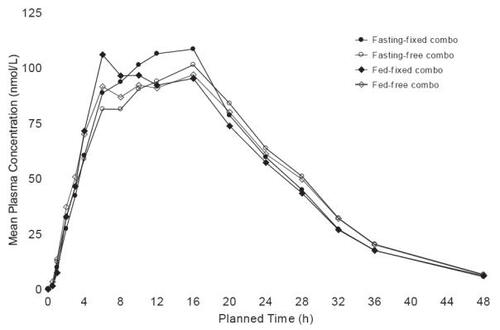
Figure 2 Mean HCT plasma concentration versus time curve after administration of the fixed combination tablet and the free combination of metoprolol succinate ER (1 × 95 mg) and HCT (1 × 12.5 mg) in a fasting (n = 48) and fed state (fixed; n = 48, free; n = 47): Study D4026C00005.
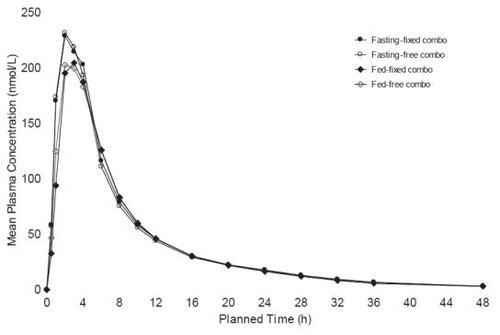
Figure 3 Dose response surface from polynomial regression of changes from baseline to week 8/LOCF in trough sitting diastolic blood pressure (intent-to-treat population) (ATTACH Trial).
Regression equation: DBP: y = −5.34392 −0.06023*Toprol-XL −0.34772*HCT + 0.00015*Toprol-XL2 + 0.00703*HCT2.
Reprinted with permission from Papademetriou V, Hainer JW, Sugg J, et al, and ATTACH Study Group. 2006. Factorial antihypertensive study of an extended-release metoprolol and hydrochlorothiazide combination. Am J Hypertens, 19:1217–25. Copyright © 2006 American Journal of Hypertension, Ltd.
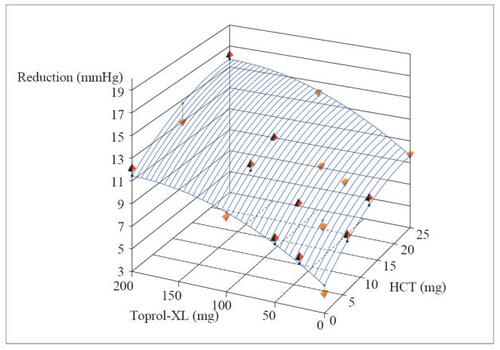
Figure 4 Dose response surface from polynomial regression of changes from baseline to Week 8/LOCF in trough sitting diastolic blood pressure (intent-to-treat population) (ATTACH Trial).
Regression equation: SBP: y = −4.20691 −0.08645*Toprol-XL −0.63844*HCT + 0.00026*Toprol-XL2 + 0.01324*HCT2.
Reprinted with permission from Papademetriou V, Hainer JW, Sugg J, et al, and ATTACH Study Group. 2006. Factorial antihypertensive study of an extended-release metoprolol and hydrochlorothiazide combination. Am J Hypertens, 19:1217–25. Copyright © 2006 American Journal of Hypertension, Ltd.
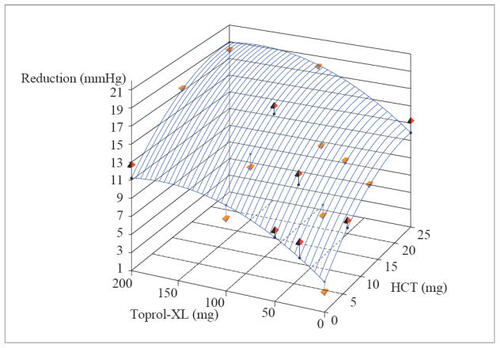
Table 1 Placebo-corrected predicted valuesTable Footnoteafor change from baseline in SBP/DBP
Table 2 Clinical studies of metoprolol/hydrochlorothiazide combination tablets
Table 3 Clinical outcome trials in support of safety and tolerability with combination treatment
Figure 5 Potassium values: mean change from baseline to Visit 8 (safety population) (ATTACH Trial).