Figures & data
Table 1 Demographics, baseline blood pressure measurementsTable Footnotea and echocardiographic parametersTable Footnoteb
Table 2 Influencing factors of left ventricular mass index at baseline
Figure 1 Changes in ambulatory blood pressure after 52 weeks of treatment with perindopril/indapamide (n = 65) or enalapril (n = 62). A. Over 24 hours; B. Daytime; C. Night-time. Mean changes from baseline and standard deviations in parentheses are presented. *p vs baseline ≤0.01; **p vs baseline ≤0.001, †p vs enalapril <0.01.
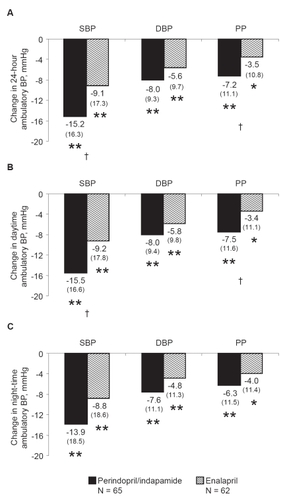
Table 3 Change in office blood pressure between baseline and study end
Figure 2 Variations in blood pressure over 24 hours in perindopril/indapamide (n = 65) and enalapril (n = 62). A. SBP; B. DBP; C. PP. Mean baseline and end-of-study ambulatory blood pressure calculated every 2 hours are plotted.
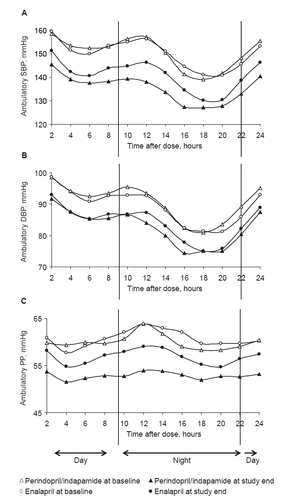
Table 4 Global trough/peak ratio and smoothness index at study end
Figure 3 Relationship between mean systolic blood pressure over 24 hours (mmHg) change (Wend − W0) and left ventricular mass index change in enalapril group (n = 62). ρ: Pearson correlation coefficient.
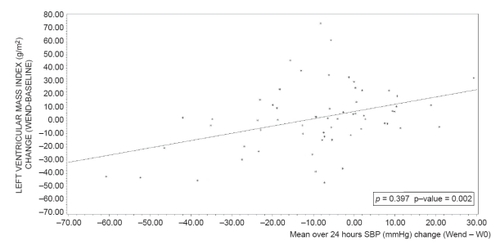
Figure 4 Relationship between mean SBP over 24 hours (mmHg) change (Wend − W0) and left ventricular mass index change (Wend − baseline) in perindopril/indapamide group (n = 65). ρ: Pearson correlation coefficient.
Regression equation: LVMI change (WEND-Baseline) (ENA) = 6.8649 + 0.551855 *SBPMEAN24_CHANGE AT WEND
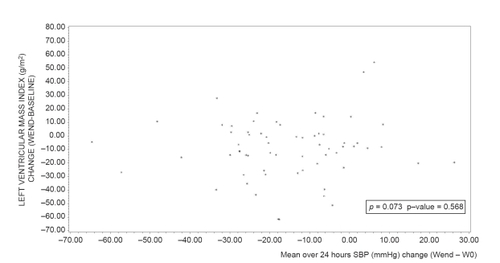
Table 5 Influencing factors of left ventricular mass index (LVMI) change