Figures & data
Table 1 Clinical characteristics of the patients (n = 109)
Table 2 Echocardiographic parameters
Table 3 Association of BNP or CRP with the other variables
Table 4 Linear regression analysis for BNP and CRP
Table 5 Univariate and multivariate cox regression analysis
Figure 1 ROC curves and the sensitivity/specificity of BNP (A) or CRP (B) level for predicting the cardiovascular events in diabetic patients. Areas under the ROC curve (AUC) for BNP or CRP are shown in the diagrams.
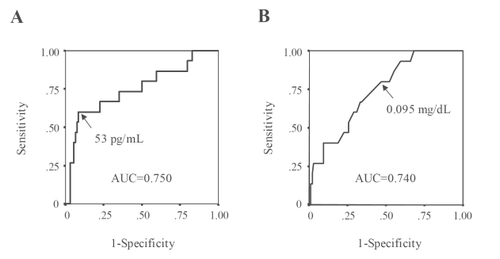
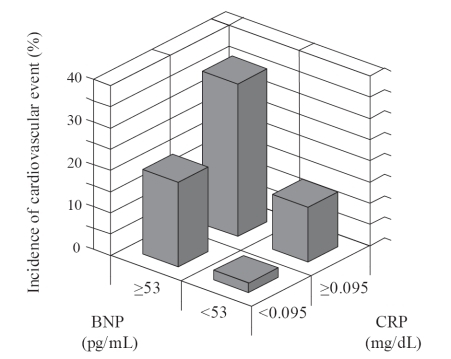
Figure 2 Incidence of cardiovascular events after 30 months of follow-up by categories of BNP and CRP at baseline. Group I (n = 45), BNP <53 pg/mL and CRP <0.095 mg/dL; group II (n = 10), BNP ≥53 pg/mL and CRP <0.095 mg/dL; group III (n = 32), BNP <53 pg/mL and CRP ≥0.095 mg/dL; group IV (n = 22), BNP ≥53 pg/mL, and CRP ≥0.095 mg/dL.