Figures & data
Figure 1 CT scan showing hemorrhage in the left thalamus secondary to hypertension.
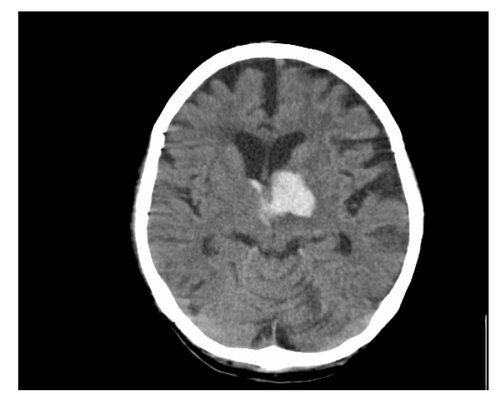
Figure 2 Axial T2- weighted MR image showing multiple abnormal flow void (arrow) signals indicating presence of an arteriovenous malformation in the left temporal lobe.
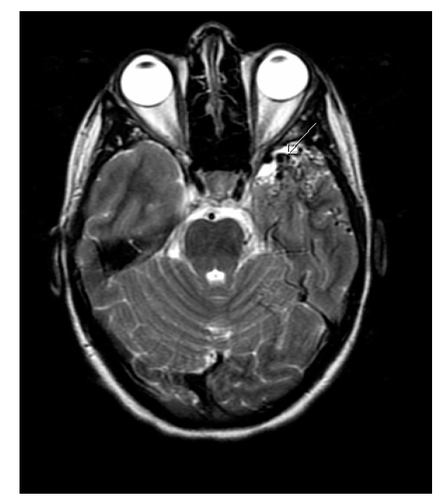
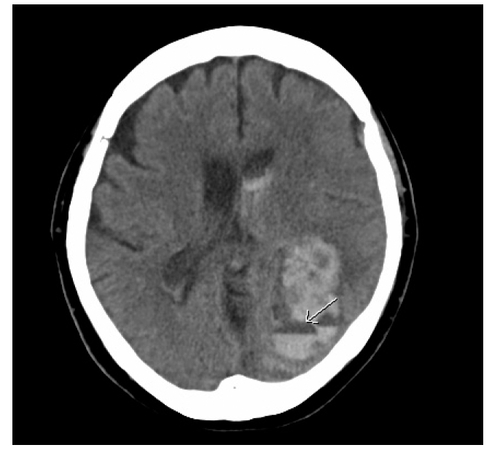
Figure 3 CT scan showing large left parietal lobe lobar hemorrhage with a fluid level (arrow) after the patient received r-TPA.