Figures & data
Table 1 Patient baseline demographics
Figure 1 (A) Unadjusted mean PDC, and (B) percentage of patients achieving the primary adherence endpoint (PDC ≥ 80%) at 180 days’ follow-up.
*p < 0.0001 amlodipine/atorvastatin vs all other cohorts.
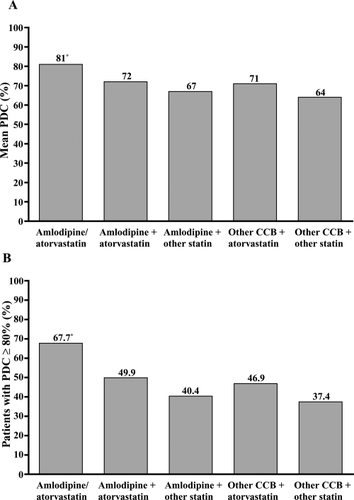
Figure 2 Adjusted probability of achieving adherence (PDC ≥ 80%) at 180 days’ follow-up. Logistic regression model analysis adjusting for covariates including age, gender, business type, formulary type, baseline antihypertensive therapy, cardiovascular disease medications, antidiabetic medications, antidepressants, number of drugs, co-payments, and maintenance medication refill percentage.
*p < 0.0001 for group comparison parameter estimate in the regression.
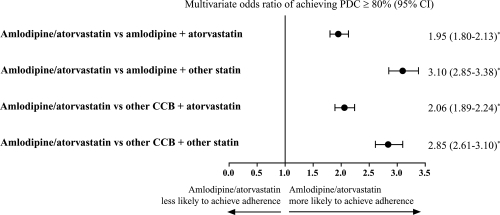
Figure 3 (A) Estimated unadjusted Kaplan-Meier curves for time to therapy discontinuation, and (B) adjusted hazard ratio of discontinuing therapies. Proportional hazard model analysis adjusting for covariates including age, gender, business type, formulary type, baseline antihypertensive therapy, cardiovascular disease medications, antidiabetic medications, antidepressants, number of drugs, co-payments, and maintenance medication refill percentage.
*p < 0.0001 for group comparison parameter estimate in the regression.
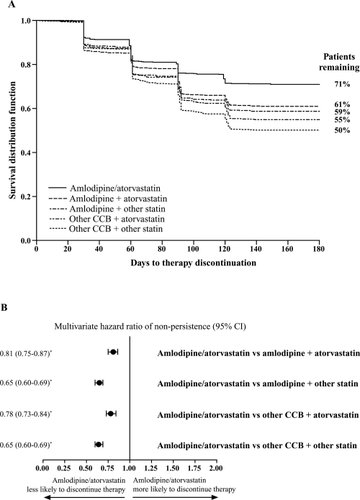
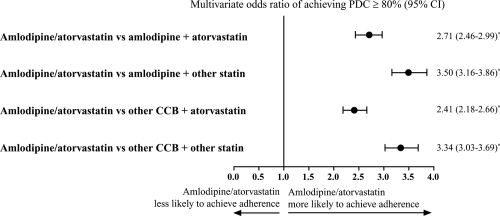
Figure 4 Adjusted probability of achieving adherence (PDC ≥ 80%), over 1-year follow-up. Logistic regression model analysis adjusting for covariates including age, gender, business type, formulary type, baseline antihypertensive therapy, cardiovascular disease medications, antidiabetic medications, antidepressants, number of drugs, co-payments, and maintenance medication refill percentage.
*p < 0.0001 for group comparison parameter estimate in the regression.