Figures & data
Table 1 Summary characteristics of amylin and pramlintide
Table 2 Studies of pramlintide use in patients with type 1 DM
Table 3 Studies of pramlintide use in patients with type 2 DM
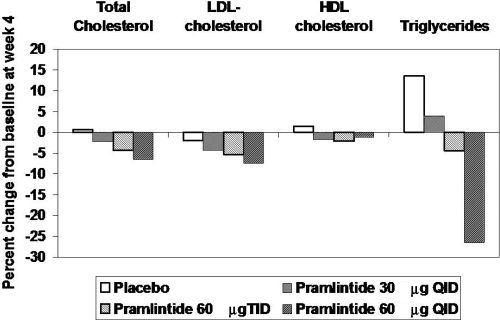
Figure 1 Mean percent changes in lipid values in 203 type 2 diabetic patients on placebo and 3 different doses of pramlintide for 4 weeks. Derived from CitationThompson et al (1998).