Figures & data
Table 1 The characteristics of the subjects
Figure 1 Systolic (A) and diastolic (B) blood pressure in nonsmokers and smokers. A two-tailed, unpaired Student’s t-test with Welch’s correction was used. There was no significant difference between the two groups neither for systolic nor for diastolic blood pressure (n = 17, p > 0.05).
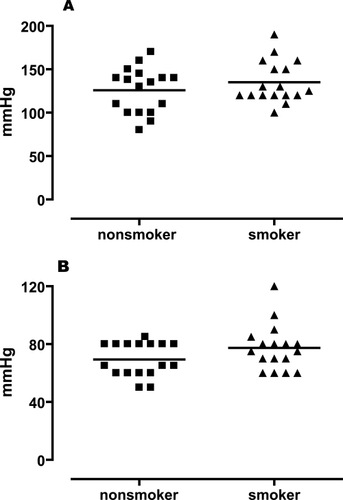
Figure 2 Skin blood flow changes (percent of perfusion units). (A) ACh-induced relaxation (given as perfusion unit) of microcirculation in nonsmokers matched with smokers, (B) percent changes of microcirculation in response to ACh in nonsmokers and smokers, and (C) comparing Hill slopes of the individual response curves of nonsmokers and smokers. Two-way ANOVA with Bonferroni post-test for comparing dose response curves. A two-tailed, unpaired Student’s t-test with Welch’s correction was used to compare Hill slopes of the response curves and percent changes of the response between non smokers and smokers. Values are given as mean ± SEM. (n = 17, *p < 0.05, **p < 0.01, and ***p < 0.001).
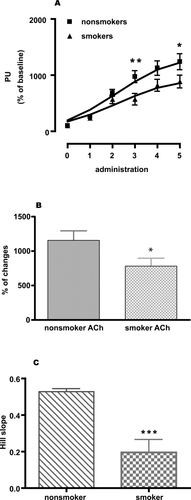
Figure 3 Skin blood flow changes (percent of perfusion units). (A) SNP-induced relaxation (given as perfusion unit) of microcirculation in nonsmokers matched with smokers, (B) percent changes of microcirculation in response to SNP in nonsmokers and smokers and (C) comparing Hill slopes of the individual response curves of nonsmokers and smokers. Two-way ANOVA with Bonferroni post-test for comparing dose response curves. A two-tailed, unpaired Student’s t-test with Welch’s correction was used to compare Hill slopes of the response curves and percent changes of the response between nonsmokers and smokers. Values are given as mean ± SEM. (n = 17, *p < 0.05, **p < 0.01, and ***p < 0.001).
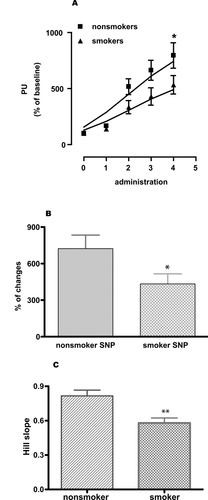
Figure 4 Skin blood flow changes (percent of perfusion units). (A) Local heating (44 °C)-induced relaxation (given as perfusion unit) of microcirculation in nonsmokers matched with smokers and (B) percent changes of microcirculation in response to heating in nonsmokers and smokers. Two-way ANOVA with Bonferroni post-test for comparing response lines. A two-tailed, unpaired Student’s t-test with Welch’s correction was used to compare percent changes of the response between non smokers and smokers. Values are given as mean ± s.e.m. (n = 17, p < 0.001).
