Figures & data
Figure 1 Schematic presentation of the study protocol indicating time-points when coronary sinus samples and recordings of coronary blood flow (CBF) and diameter were taken.
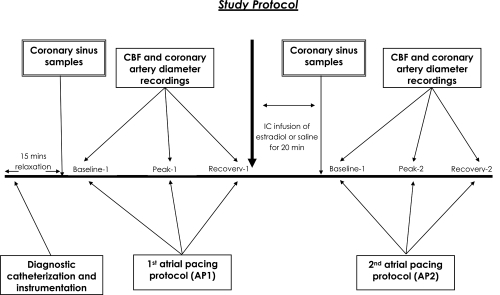
Figure 2 Representative coronary blood flow (CBF) of left anterior descending artery of a postmenopausal woman in the treated group at the two atrial pacing (AP) protocols before (upper panel) and after estrogen administration (low panel).
Abbreviations: AP, aortic pressure; ECG, electrocardiogram.
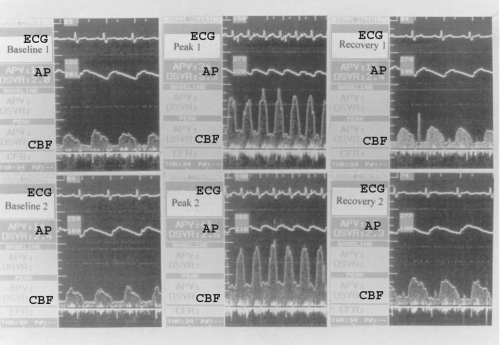
Table 1 Clinical characteristics of the study population
Figure 3 Plot of coronary artery diameter at baseline-1, peak-1, recovery-1, and baseline-2, peak-2, recovery-2 of the first and second atrial pacing (AP) protocol, respectively. Upper panel: For the treated group before (solid line) and after estrogen administration (dotted line). Low panel: For the control group before (solid line) and after saline administration (dotted line).
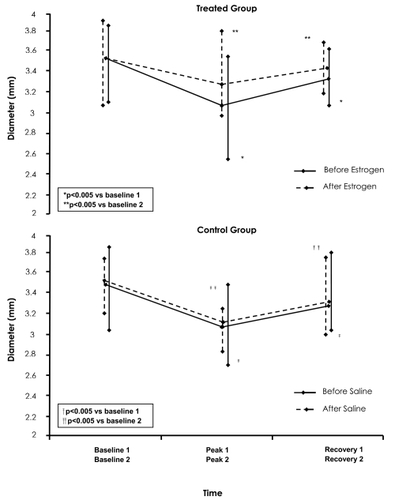
Figure 4 Plot of coronary blood flow (CBF) at baseline-1, peak-1, recovery-1 and baseline-2, peak-2, recovery-2 of the first and second atrial pacing (AP) protocol, respectively. Upper panel: For the treated group before (solid line) and after estrogen administration (dotted line). Low panel: For the control group before (solid line) and after saline administration (dotted line).
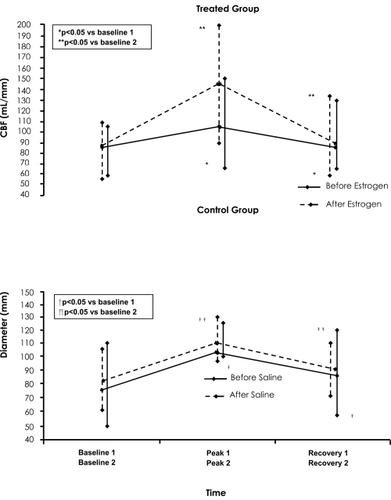
Table 2 Coronary artery responses at first atrial pacing protocol in the treated group (n = 18)
Table 3 Coronary artery responses at second atrial pacing protocol in the treated group (n = 18)
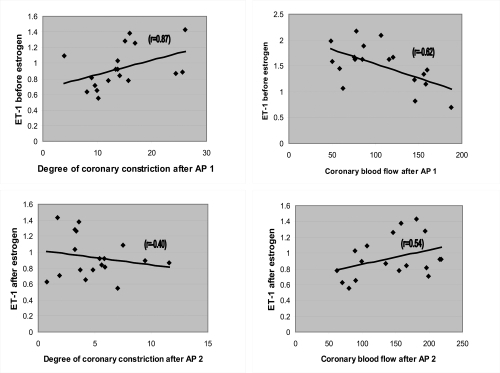
Figure 5 Graphs of correlations of coronary blood flow (CBF) or degree of constriction, and levels of endothelin before and after estrogen infusion when atrial pacing (AP) is incorporated.