Figures & data
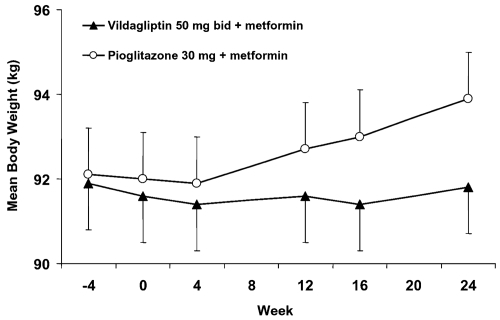
Figure 1 Mean (± SE) HbA1c during 52-week treatment with vildagliptin (50 mg qd, closed triangles, n = 42) and placebo (open circles, n = 29) in metformin-treated patients with T2DM. The between-group difference in HbA1c from baseline to endpoint was −1.1 ± 0.2% (p < 0.0001) (CitationAhren et al 2004a). Copyright © American Diabetes Association. From Diabetes Care®, Vol. 27, 2004; 2874–80. Modified with permission from The American Diabetes Association.
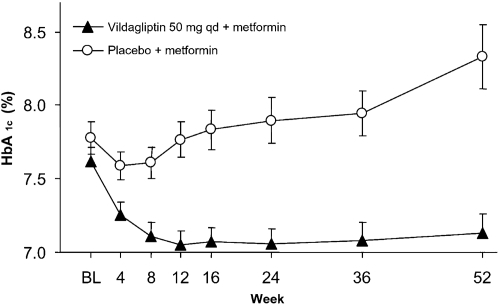
Table 1 Patients’ baseline characteristics: addition of vildagliptin in patients with inadequate glycemic control on maximum tolerated doses of metformin alone
Figure 2 Study 2 – Adjusted mean change from baseline to endpoint in HbA1c after 24 weeks of treatment with vildagliptin (50 mg bid) or placebo in metformin-treated patients with T2DM (p < 0.001) (CitationBosi et al 2007a).
Study 3 – Adjusted mean change from baseline to endpoint in HbA1c after 24 weeks of treatment with vildagliptin (50 mg bid) or pioglitazone (30 mg qd) in metformin-treated patients with T2DM; the between group difference was 0.10 ± 0.08% (95 CI: −0.05, −0.26) (CitationBolli et al 2008).
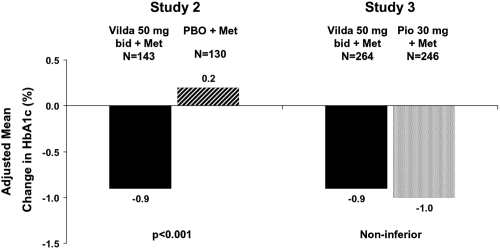
Figure 3 Study 3 – Time-course of mean body weight during 24-week treatment with vildagliptin (50 mg bid, closed triangles, n = 264) or pioglitazone (30 mg qd, open circles, n = 246) in T2DM patients continuing their previous stable metformin dose regimen (Derived from data of CitationBolli et al 2008).