Figures & data
Table 1 Study designs and efficacy outcomes
Figure 1 Adjusted mean change from baseline in glycosylated hemoglobin (HbA1c), fasting plasma glucose (FPG), and glucose area under the curve (AUC) after Sustacal challenge. All parameters were significantly reduced from baseline (p ≤ 0.0001) in the active treatment groups. All values were significantly reduced compared to placebo (p ≤ 0.0001) except for glucose AUC with metformin monotherapy (not significant, NS). *p ≤ 0.01; **p ≤ 0.001; ***p ≤ 0.0001. Open bars = placebo; light gray bars = nateg-linide monotherapy; dark gray bars = metformin monotherapy; black bars = nateglinide plus metformin (CitationHorton et al 2000). Copyright © 2000 American Diabetes Association. From Diabetes Care®, Vol 23, 2000; 1660–1665. Reprinted with permission from The American Diabetes Association.
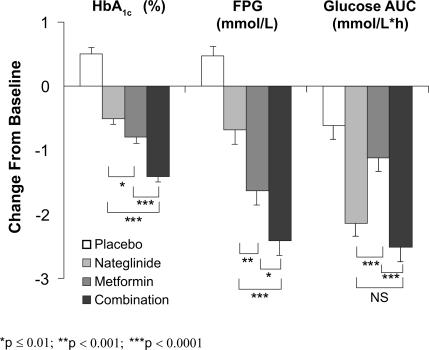
Figure 2 Time course of HbA1c in drug-naïve patients with type 2 diabetes randomized to the nateglinide/metformin combination (closed triangles) or the glyburide/metformin combination (open circles). Mean ± SE, intention-to-treat population (CitationGerich et al 2005). Copyright © 2005 American Diabetes Association. From Diabetes Care®, Vol 28, 2005; 2093–2099. Reprinted with permission from The American Diabetes Association.
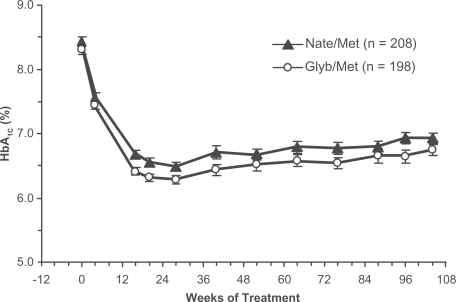
Table 2 Effects of initial combination therapy with nateglinide (Nate) or glibenclamide (Glyb) plus metformin (Met) on glycemic control and prothrombotic factors during 1-year treatment of overweight and hypertensive patients with type 2 diabetes (CitationDerosa et al 2007)