Figures & data
Table 1 Descriptive clinical characteristics of the patients at inclusion, displayed for all patients and by treatment group. Except for age and gender, no significant difference was observed between groups at inclusion
Table 2 Prevalence of metabolic syndrome among the study population as a whole and distributed by therapeutic group
Figure 1 Incidence of hypertension-related cofactors of cardiovascular risk in the study population distributed by therapeutic group. For all parameters, significant differences (p < 0.0001) were found between groups except for the familial history of hypertension (ns between Group A and Group B), and tobacco consumption (ns between Group B and Group C).
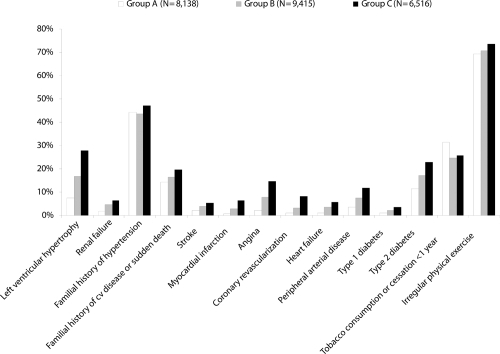
Table 3 Incidence of hypertension-related cofactors of cardiovascular risk in the study population distributed according to the presence or absence of MS. For all parameters except personal history of stroke (equivalent incidence), significant differences (p < 0.001) were found between groups
Figure 2 Rates of BP control among the study patients distributed by treatment group and according to the presence or not of MS. No significant difference was observed between the group of patients with MS vs the group of patients without MS (p = NS), but significant differences were found between subgroups A, B, and C among the two patient groups “with MS” and “without MS”.
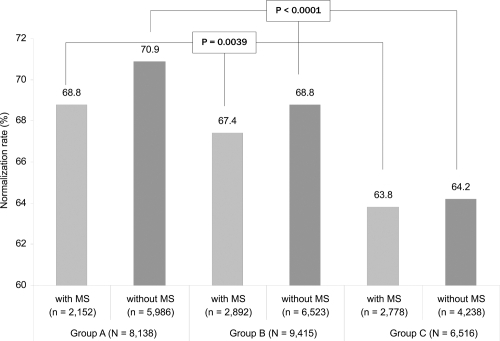
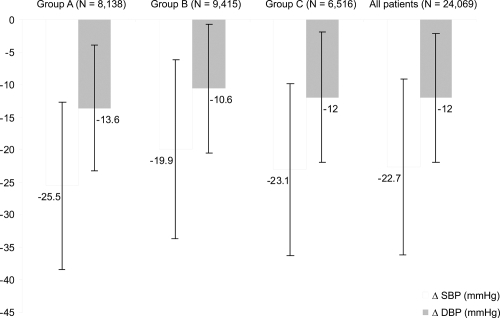
Figure 3 BP lowering (difference from baseline) in the population as a whole and in the three subgroups of patients. Significant differences were found both on the comparison between groups (p < 0.0001 for all) and on BP difference from baseline (p < 0.0001).