Figures & data
Table 1 Demographic characteristics of studied groups
Table 2 Parameters of patient compliance in studied groups (parameters are expressed as mean ± SD)
Figure 1 The changes in weekly number of chest pain episodes and additional short-acting nitrates taken in case of need with time in studied groups.Two initial weeks constitute baseline period.
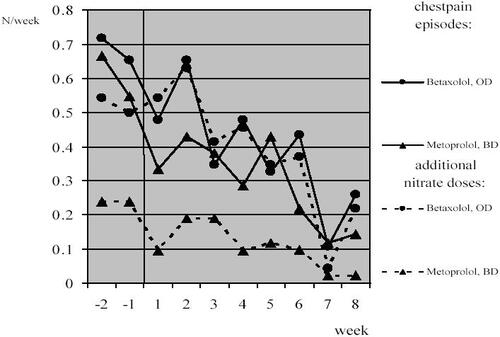
Table 3 EQ-5D dimension scores and visual analog health scale (VAS) scores at randomization (V0) and the final visit (V8)
Table 4 Changes to the quality of life dimensions after 8 weeks of active treatment