Figures & data
Figure 1 Renin-angiotensin-aldosterone system and the sites of blockade. Thick arrows indicate main pathways, thin arrows denote alternative pathways and dashed arrows show sites of blockade.
Abbreviations: ACE, angiotensin converting enzyme; ARB, angiotensin receptor blocker; AT-R, angiotensin receptor; DRI, direct renin inhibitor; LVH, left ventricular hypertrophy.
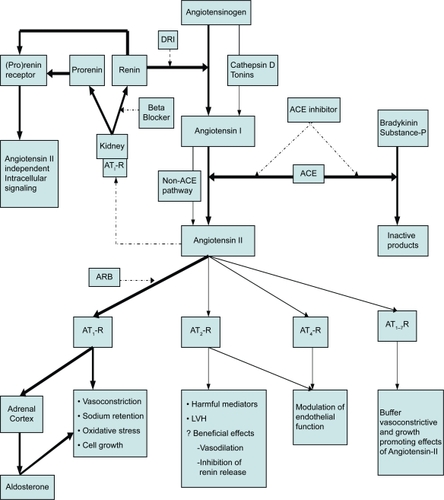
Table 1 Medication effects on RAAS pathway
Table 2 Studies of aliskiren therapy in hypertension