Figures & data
Figure 1 Renin-angiotensin-aldosterone system and site of action of different drugs that block the system as well as bradykinin by-products.
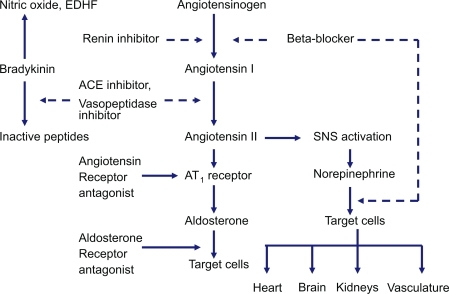
Figure 2 Cumulative mortality from all causes among patients receiving trandolapril or placebo. Reprinted with permission from CitationKober L, Torp-Pedersen C, Carlsen JE, et al 1995. A clinical trial of the angiotensin-converting-enzyme inhibitor trandolapril in patients with left ventricular dysfunction after myocardial infarction. Trandolapril Cardiac Evaluation (TRACE) Study Group. N Engl J Med, 333:1670–6. Copyright © 1995 Massachusetts Medical Society. All rights reserved.
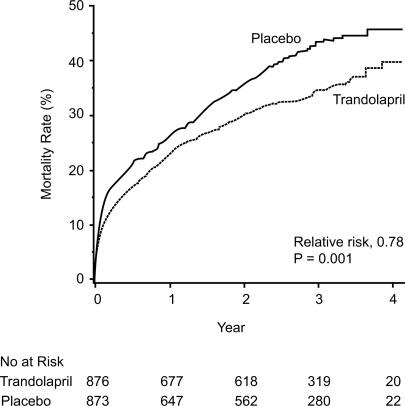
Figure 3 Event rates for the secondary end points of death from cardiovascular causes, sudden death, reinfarction and severe or resistant heart failure among patients receiving trandolapril or placebo. Reprinted with permission from CitationKober L, Torp-Pedersen C, Carlsen JE, et al 1995. A clinical trial of the angiotensin-converting-enzyme inhibitor trandolapril in patients with left ventricular dysfunction after myocardial infarction. Trandolapril Cardiac Evaluation (TRACE) Study Group. N Engl J Med, 333:1670–6. Copyright © 1995 Massachusetts Medical Society. All rights reserved.
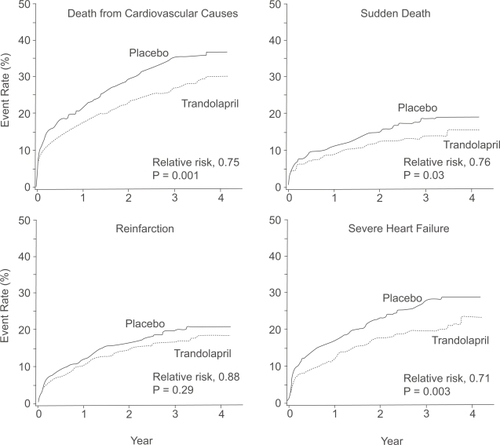
Figure 4 Cumulative mortality from all causes in the trandolapril group compared with the placebo group over 10 years of follow-up. Reprinted with permission from CitationBuch P, Rasmussen S, Abildstrom SZ, et al 2005. The long-term impact of the angiotensin-converting enzyme inhibitor trandolapril on mortality and hospital admissions in patients with left ventricular dysfunction after a myocardial infarction: follow-up to 12 years. Eur Heart J, 26:145–52. Copyright © 2005 European Society of Cardiology.
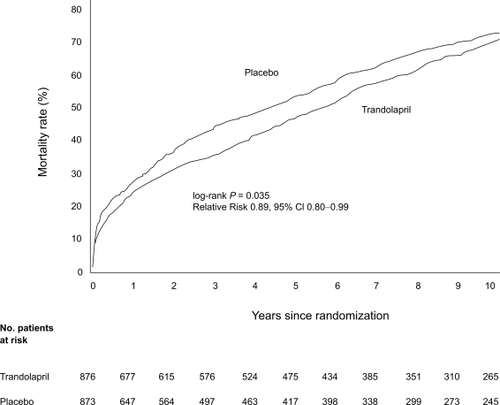
Figure 5 Cumulative mortality from all causes for patients with (A) and without (B) diabetes receiving trandolapril or placebo. Reprinted with permission from CitationGustafsson F, Torp-Pedersen C, Kober L, et al 1997. Effect of angiotensin converting enzyme inhibition after acute myocardial infarction in patients with arterial hypertension. TRACE Study Group, Trandolapril Cardiac Event. J Hypertens, 15:793–8. Copyright © 1997 Lippincott Williams & Wilkins.
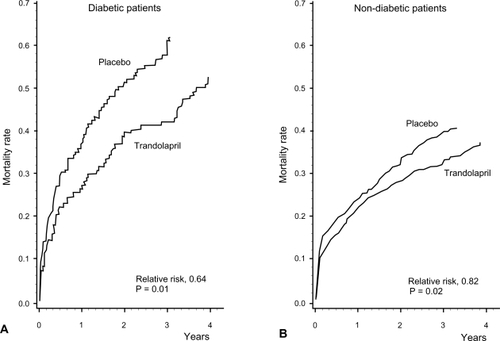
Figure 6 Cumulative incidence of primary endpoint, according to treatment allocation. Reprinted with permission from CitationBraunwald E, Domanski MJ, Fowler SE, et al 2004. Angiotensin-converting-enzyme inhibition in stable coronary artery disease. N Engl J Med, 351:2058–68. Copyright 2004 © Massachusetts Medical Society. All rights reserved.
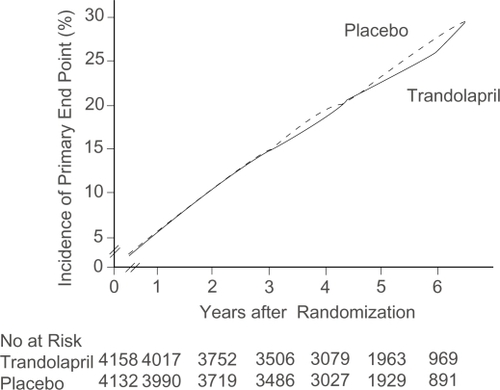
Figure 7 Comparisson of outcomes in the PEACE trial and HOPE.
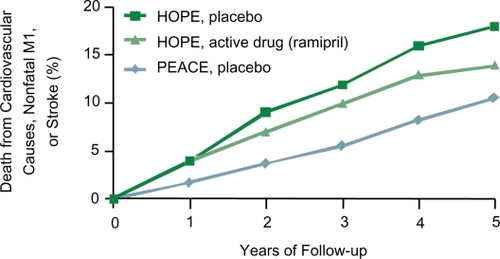
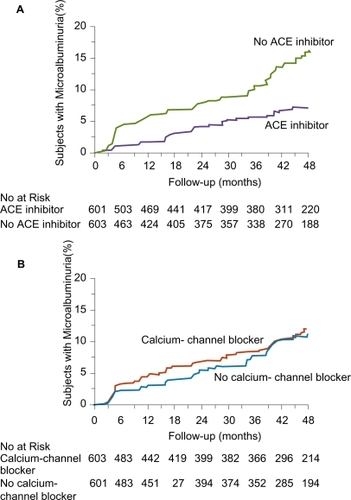
Figure 8 Kaplan–Meier Curves for the Percentages of Subjects with Microalbuminuria during Treatment with or without ACE Inhibitors (Panel A) and with or without Non-Dihydropyridine Calcium-Channel Blockers (Panel B). The difference between the group that received ACE inhibitor therapy and the group that did not, adjusted for prespecified baseline covariates (see text) was significant (p < 0.001) according to the accelerated failure-time model. The difference between the group that received non-dihydropyridine calcium-channel blockers and the group that did not was not significant (p = 0.92). Reprinted with permission from CitationRuggenenti P, Fassi A, Ilieva AP, et al 2004. Preventing microalbuminuria in type 2 diabetes. N Engl J Med, 351:1941–51. Copyright 2004 © Massachusetts Medical Society. All rights reserved.