Figures & data
Table 1 Demographic, anthropometric and biological data for the four groups before study (Mean ± SEM)
Figure 1 Levels of mean arterial pressure before and after three months’ vitamin E and conjugated linoleic acid (CLA) supplementation in patients with active rheumatoid arthritis.
Note: *p ≤ 0.05 for CLA group compared with baseline and group P.
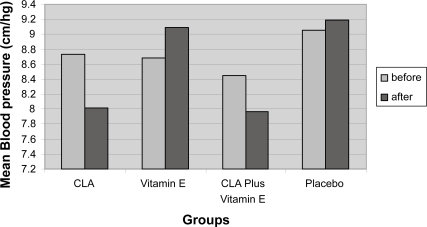
Table 2 Levels of lipid profile and blood pressure variables in patients with active rheumatoid arthritis before and after three months supplementation (Mean ± SEM)
Figure 2 Levels of C-reactive protein (CRP) before and after three months vitamin E and conjugated linoleic acid (CLA) supplementation in patients with active rheumatoid arthritis.
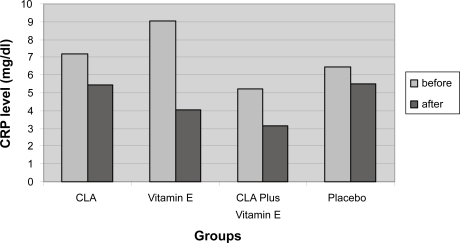
Table 3 Levels of blood pressure, oxidative stress variables in patients with active rheumatoid arthritis before and after three months supplementation (Mean ± SEM)
Table 4 Levels of FBS, inflammation variables and clinical tests in patients with active RA before and after three months supplementation (Mean ± SEM)