Figures & data
Figure 1 Study design: An open-label, randomized cross-over study. Group 1 represents patients starting with rosuvastatin plus omega-3 PUFAs, Group 2 represents patients starting with rosuvastatin only.
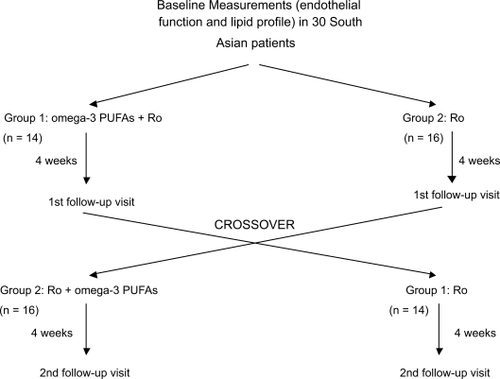
Figure 2 Average endothelial dependent vasodilation percentage (EDV%) for groups 1 and 2 during each visit. Group 1 represents patients starting with rosuvastatin plus omega-3 PUFAs, Group 2 represents patients starting with rosuvastatin only. Data represent mean per group ± SE.
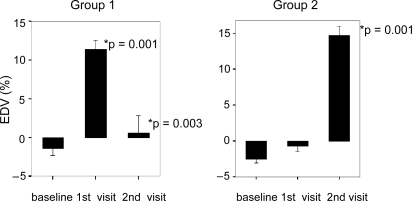
Figure 3 Average endothelial independent vasodilation percentage (EIV%) for groups 1 and 2 during each visit. Group 1 represents patients starting with rosuvastatin plus omega-3 PUFAs. Group 2 represents patients starting with rosuvastatin only. Data represent mean per group ± SE.
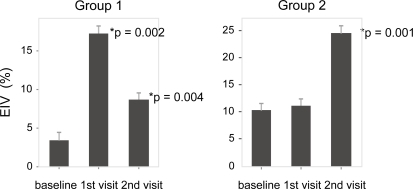
Figure 4 Lipid profile (including total cholesterol (TCh), high density lipoprotein (HDL), low density lipoprotein (LDL), and triglycerides (TG) for groups 1 and 2 at baseline (b), visit 1 (1), and visit 2 (2). Group 1 represents patients starting with rosuvastatin plus omega-3 PUFAs. Group 2 represents patients starting with rosuvastatin only. Data represent mean per group ± SE.
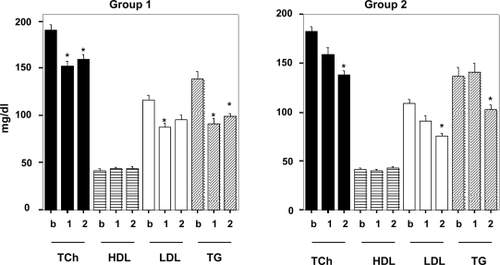
Table 1 Baseline characteristics of the study subjects
Table 2 Laboratory values
Table 3 Assessment of endothelial function by brachial artery ultrasound
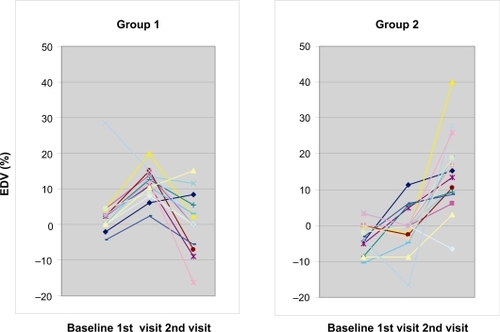
Figure 5 Plotted results of endothelium dependent vasodilation percentage (EDV%) for each individual patient in group 1 and 2 between each visit. Group 1 represents patients starting with rosuvastatin plus omega-3 PUFAs, Group 2 represents patients starting with rosuvastatin only.