Figures & data
Figure 1 Angiographic images of stent thrombosis on RCA (A) and LAD (B).
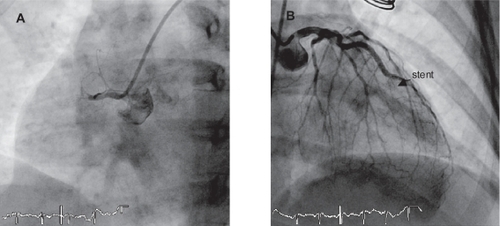
Figure 2 Panel A: successful passage of the wire, while the balloon is inserted over another wire at the place where it stopped. Panel B and C: Final angiographic result on RCA (B) and LAD (C).
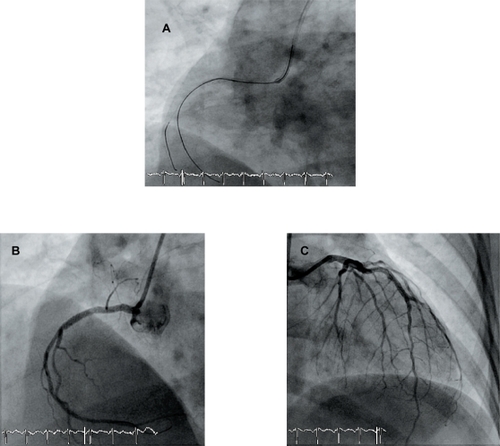
Table 1 Factors implicated in pathophysiology of in-stent thrombosis
Table 2 Insulin resistance and hyperglycemia effects on brinolysis, coagulation, and platelet function
Figure 3 Pathways of platelet activation and mechanism of action of antiplatelet agents.
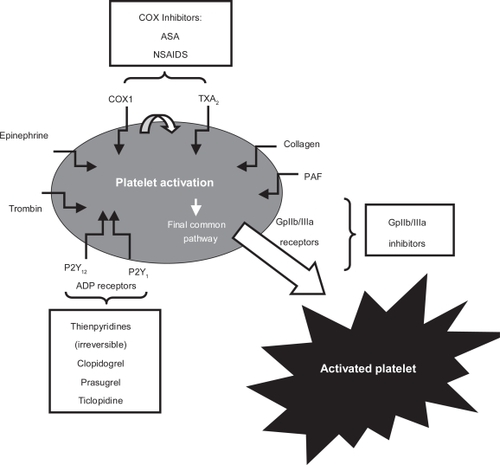
Table 3 Tests used to evaluate antiplatelet effect of ASA
Table 4 Studies performed in diabetic patients treated with DES
Table 5 Academic research consortium de nitions of stent thrombosis
Table 6 ST classification according to time of presentation