Figures & data
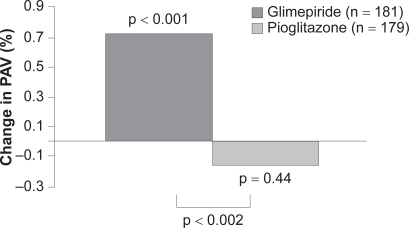
Figure 1 Kaplan–Meier curves showing the proportion of patients in pioglitazone and gliclazide treatment groups not failing (HbA1c <8.0%) at various time points over 2 years. Copyright © 2005 American Diabetes Association. From Diabetes Care®, Vol. 28, 2005;544–550. Reprinted with permission from The American Diabetes Association.
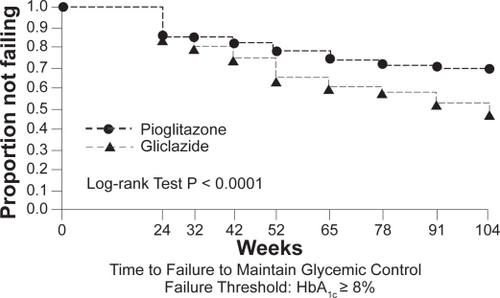
Table 1 In the study of Goldberg et al a total of 802 subjects were randomized to blinded treatment with maximal dose of either pioglitazone or rosiglitazone to determine the effect of these agents on fasting lipids in the setting of no other glucose or lipid-lowering therapy. The observed changes in lipid concentrations from baseline are shownCitation73
Figure 2 In patients with type 2 diabetes and coronary artery disease, treatment with pioglitazone resulted in a significantly lower rate of progression of coronary atherosclerosis compared with glimepiride. Developed from data of Nissen et al 2008.Citation83