Figures & data
Figure 1 Pathophysiology of hemodynamic instability due to PE and mechanism of biomarkers increase.
Abbreviations: H-FABP, heart type fatty acid-binding proteins; LV, left ventricular; PE, pulmonary embolism; RV, right ventricular.
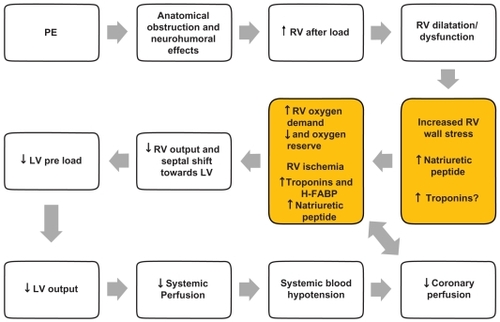
Figure 2 ESC criteria for identifing the risk of adverse prognosis in acute PE
Abbreviations: BNP, brain natriuretic peptide; ESC, European Society of Cardiology; PF, pulmonary embolism; RVD, right ventricular dysfunction.
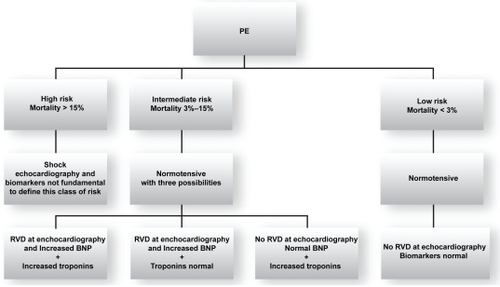
Figure 3 PE treatment according to modern guidelines.
Abbreviations: BNP, brain natriuretic peptide; RHD, right heart dysfunction; IV, intravenous; SC, subcutaneous.
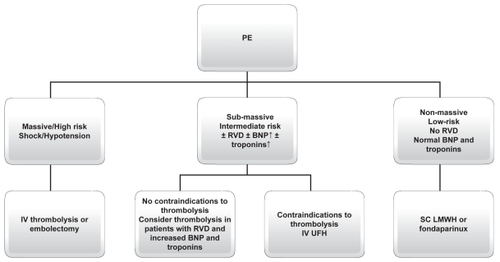
Figure 4 Pulmonary embolism severity index (P.E.S.I). Modified from Aujesky D, Perrier A, Roy PM, et al. Validation of a clinical prognostic model to identify low-risk patients with pulmonary embolism. J Intern Med. 2007;261:597–604.
Abbreviations: COPD, chronic obstructive pulmonary disease; HR, heart rate; bpm, beats per minute; SBP, systolic blood pressure; RR, respiratory rate; BT, body temperature; SaO2 arterial saturation of oxygen.
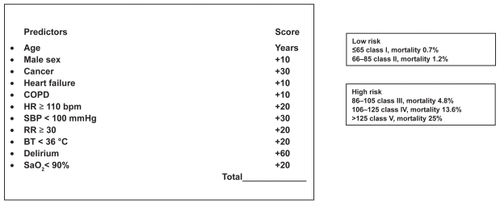
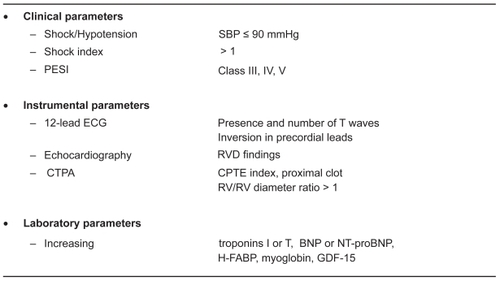
Figure 5 Clinical, instrumental and laboratory parameters associated with adverse outcomes in patients with acute Pe.
Abbreviations: SBP, systolic blood pressure; ECG, echocardiogram; ESI, Pulmonary Embolism Severity Index; RVD, right ventricular dysfunction; CTPA, computer tomography pulmonary angiography; BNP, brain natriuretic peptides; HTFABP, heart type fatty acid binding protein; GFD-15, Growth differentiation factor-15; CTPE, computer tomography pulmonary embolism.