Figures & data
Figure 1 Schematic representation of the proximal and distal ends of the radial artery.
Abbreviation: RCA, right coronary artery.
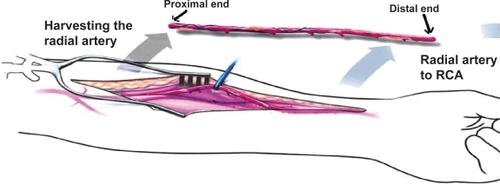
Figure 2 Representative sections of the radial artery showing different histopathological findings encountered in the study.
Abbreviations: IH, intimal hyperplasia; M, media.
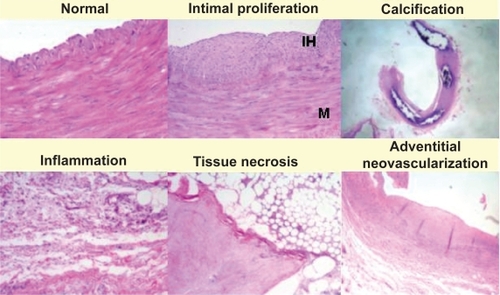
Table 1 Clinical and demographic characteristics of the study population
Table 2 Comparison of the histopathology of the distal ends of radial arteries (close to the puncture site) between TRA group vs NCA group
Table 3 Comparison of the histopathology of the proximal ends (away from the puncture site) of radial arteries between TRA group and NCA group
Table 4 Comparison between the histopathology of the proximal end and the distal end of radial arteries in the TRA group