Figures & data
Table 1 Characteristics of the study population at baseline
Figure 1 Blood pressure systolic (SBP) and diastolic (DBP) at baseline and after 12 weeks treatment with irbesartan and lisinopril. The changes are statistically significant for both drugs (p < 0.05) for SBP and DBP.
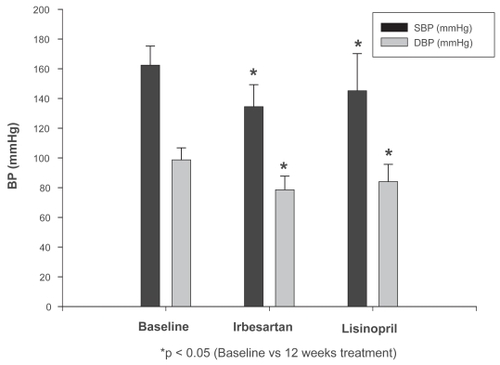
Table 2 Baseline and end of trial results