Figures & data
Table 1 Population features, blood chemistry, Hct and MAP of pre- and postmenopause women
Figure 1 Distribution of hematocrit (Hct) and mean arterial blood pressure (MAP) in pre- and postmenopausal women in the city of Durango, Mexico. Both distributions are Gaussian.
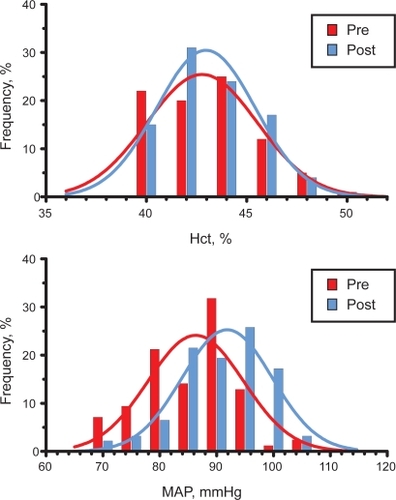
Figure 2 Linear regression between MAP and Hct in pre- and postmenopause women in the city of Durango, Mexico. comparison with the relation between MAP and Hct if blood viscosity is the only determinant of peripheral vascular resistance.
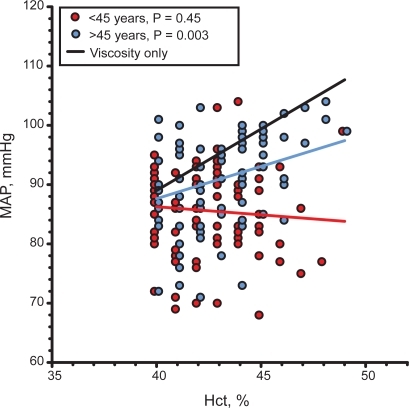
Figure 3 Comparison of the trends for MAP vs Hct for women aged > 60 years in a study in the city of Stockholm (n = 2,189) and postmenopause women in the city of Durango (n = 92).
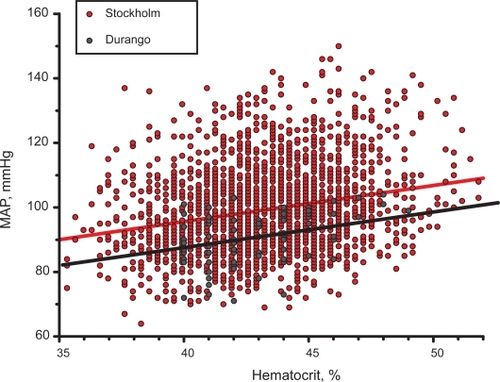
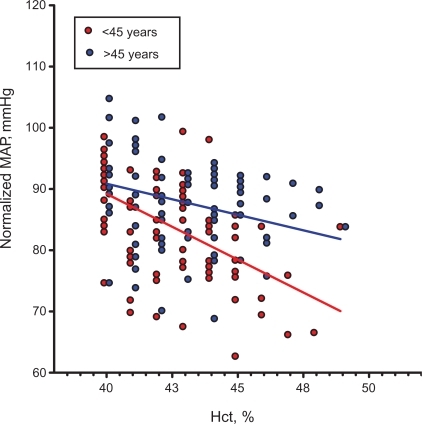
Figure 4 Mean arterial pressure as a function of hematocrit (Hct), and therefore blood viscosity, when the effect of hematocrit is factored out (normalized MAP according to equation) Both trends are statistically significant (p< 0.05 for <45 years and >45 years) as well as the difference in trends (p < 0.02).