Figures & data
Figure 1 Score card used for effective DVT risk stratification of the subjects.
Abbreviations: CHF, chronic heart failure; COPD, chronic obstructive pulmonary disease; DVT, deep vein thrombosis; HRT, hormone replacement therapy; IBD, irritable bowel disease; OCP, oral contraceptive pill.
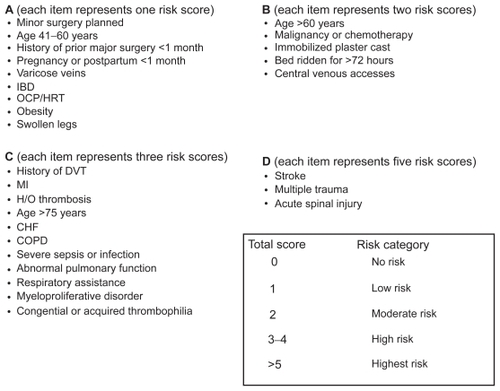
Table 1 Signs and symptoms of DVT and PE that were looked for in the subject patients
Table 2 Demographic details of the patients
Table 3 Baseline clinical characteristics of the patients
Table 4 Risk categorization of the patients of DVT risk during their initial visit