Figures & data
Table 1 Characteristics of the investigated study populationsTable Footnotea
Figure 1 Fraktalkine levels in patients following rehabilitaiton are not higher than fractalkine levels in healthy control subjects. Blood samples of diabetic patients (IDDM; n = 47) and coronary heart disease patients (CHD; n = 46) following rehabilitation and blood samples of apparently healthy volunteers (Con; n = 50) were measured by fractalkine ELISA. Mean and standard error of the mean are presented. Significances are given above the columns.
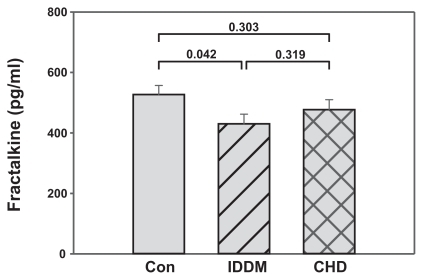
Figure 2 Induction of postprandial hyperlipemia reduces fractalkine levels in healthy control subjects, but not in patients following rehabilitation. Blood samples of IDDM and CHD patients following rehabilitation and blood samples of healthy subjects (Con) were collected at time-point 0. Immediately thereafter a postprandial hyperlipemia was induced by a defined meal of 1,285 kcal/m2 body suface (105 g fat + 300 mg cholesterol + 48 g carbohydrates + 32 g protein. At two time-points later (four and eight hours, respectively) blood samples were taken and measured by fractalkine ELISA. Data are presented as a box blot (SigmaPlot). The whiskers and box lines indicate the 10th, 25th, median, 75th, and 90th percentiles. The broken line indicates the mean. Extra symbols indicate outliers. Analysis by one-way ANOVA showed a significant difference between the fractalkine levels at the time-points of the control subjects (P = 0.004), whereas levels for the diabetic (P = 0.080) and the CAD (P = 0.574) patients were not significantly different at the given time-points. Post-hoc analysis at the 0.01 level showed the same result; however, diabetic patients at the time-point 0 and 4 were different at the 0.05 level (P = 0.033).
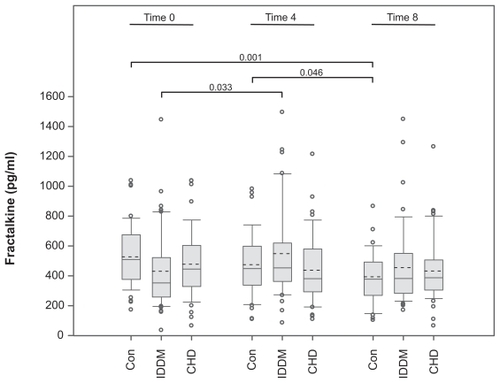
Figure 3 Reduction in fractalkine levels in lipofundin-treated cultures of vessel wall cells. Human vascular smooth muscle cells (20,000 SMC/cm2) were cultured in 24-well plates. After 24 hours the medium was changed and fractalkine production induced by costimulation with interferon-γ and tumor necrosis factor-α (200 U/ml, 20 ng/ml, respectively). Parallel cultures were incubated in the presence of various concentrations of lipofundin. After 24 hours, the supernatants were harvested and measured by fractalkine ELISA. Two experiments provided similar results.
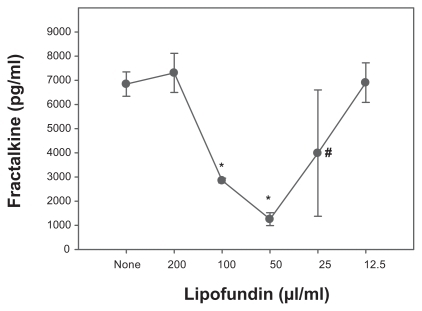
Table 2 Classical markers of inflammation and lipid metabolismTable Footnotea