Figures & data
Table 1 Baseline characteristics of patients with obstructive sleep apnea and control subjects
Figure 1 Levels of circulating endothelial progenitor cells (EPC) and apoptotic microparticles (EMP) in healthy controls and patients with obstructive sleep apnea (OSA) before and after treatment with continuous positive airway pressure (CPAP). Baseline levels of EPC were lower in OSA patients (n = 16) than in controls (n = 16) A) while levels of EMP were greater B). Levels of EPC increased significantly C) while levels of EMP tended to decreased D) when patients adhered with CPAP ≥ 4 hours daily (n = 7).
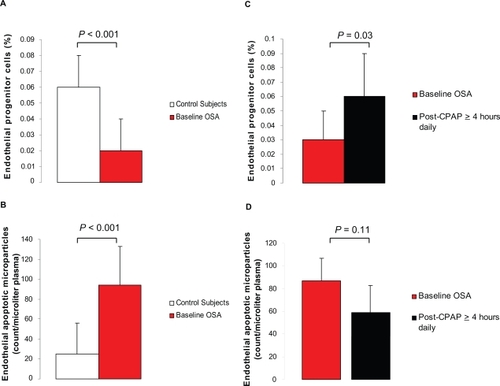
Figure 2 Relation between endothelial apoptotic rate and endothelial repair capacity in obstructive sleep apnea (OSA). Levels of circulating endothelial progenitor cells (EPC) and microparticles (EMP) are inversely related at baseline (Spearman correlation coefficient r = −0.67, P < 0.001). OSA patients (closed circles), healthy controls (open circles).
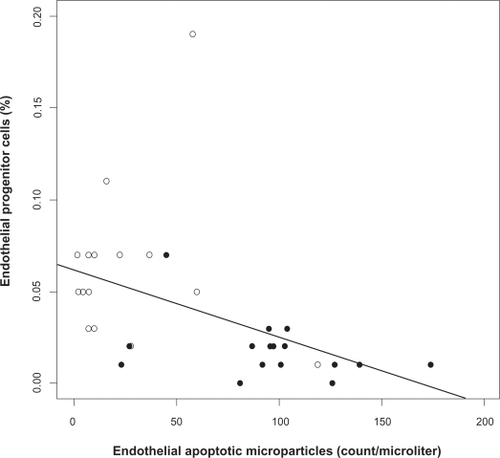
Figure 3 Relation between endothelial apoptotic rate and flow-mediated dilation in obstructive sleep apnea (OSA). Levels of circulating apoptotic microparticles correlate inversely with flow-mediated dilation in OSA (Spearman correlation coefficient adjusted for body mass index r = −0.43, P = 0.02). OSA patients (closed circles), healthy controls (open circles).

Figure S1 Representative histograms of the flow cytometry analysis for endothelial apoptotic microparticles (EMP) from a control subject () and a patient with OSA (). Particles were gated based on their size (forward light scatter) in the presence of calibrator beads [region 2 (R2)] A). EMP were defined as particles ≤ 1.5 μm in size positive for monoclonal antibodies against CD31 and negative for CD42b B). Isotype-identical antibodies served as negative controls C).
![Figure S1 Representative histograms of the flow cytometry analysis for endothelial apoptotic microparticles (EMP) from a control subject (Figure 1A) and a patient with OSA (Figure 1B). Particles were gated based on their size (forward light scatter) in the presence of calibrator beads [region 2 (R2)] A). EMP were defined as particles ≤ 1.5 μm in size positive for monoclonal antibodies against CD31 and negative for CD42b B). Isotype-identical antibodies served as negative controls C).](/cms/asset/9181eccc-0154-4bfa-812d-c99180ed396f/dvhr_a_8123_sf0001_c.jpg)
Figure S2 Representative histograms of the flow cytometry analysis for endothelial progenitor cells (EPC) from a control subject () and a patient with OSA (). Mononuclear lymphocytic cell population was first gated from a plot of forward vs side scatter width [region 1(R1)].A) Those cells were then gated for positive staining for kinase insert domain receptor (KDR) (R2). B) cells that stained positive for KDR were than gated for double positive staining for CD34 and CD133 (R3). C) The percent of KDR+/CD34+/CD133+ cells was expressed as the percent of the gated events, D) Isotype-identical antibodies IgG1-PE, E) and IgG1-FITC and IgG2b-APC F) served as negative controls. Reproducibility of the measurements was assessed by obtaining two separate blood samples from eight control subjects on days 0 and 28. The overall coefficient of variation between the two measurements was 10%.
![Figure S2 Representative histograms of the flow cytometry analysis for endothelial progenitor cells (EPC) from a control subject (Figure 2A) and a patient with OSA (Figure 2B). Mononuclear lymphocytic cell population was first gated from a plot of forward vs side scatter width [region 1(R1)].A) Those cells were then gated for positive staining for kinase insert domain receptor (KDR) (R2). B) cells that stained positive for KDR were than gated for double positive staining for CD34 and CD133 (R3). C) The percent of KDR+/CD34+/CD133+ cells was expressed as the percent of the gated events, D) Isotype-identical antibodies IgG1-PE, E) and IgG1-FITC and IgG2b-APC F) served as negative controls. Reproducibility of the measurements was assessed by obtaining two separate blood samples from eight control subjects on days 0 and 28. The overall coefficient of variation between the two measurements was 10%.](/cms/asset/3f939730-9307-4747-bf65-2e21eeec806b/dvhr_a_8123_sf0002_b.jpg)