Figures & data
Table 1 Baseline characteristics of the cohort
Figure 1 Model-based estimated survival curves for survival after bypass by age.
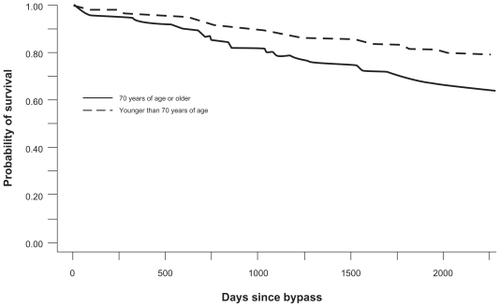
Figure 2 Model-based estimated survival curves for survival after bypass by index ABI.
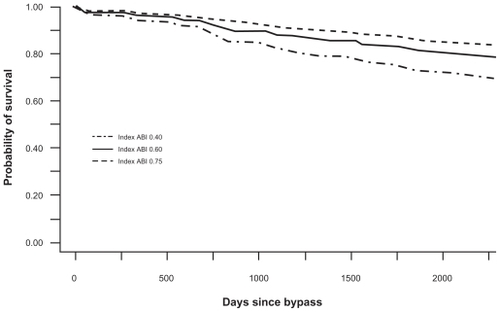
Figure 3 Model-based estimated survival curves for survival after bypass by race/ethnicity.
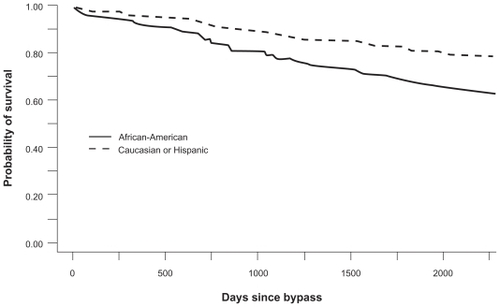
Table 2 Risk factors for mortality following each type of surgery
Figure 4 Model-based estimated survival curves for survival after amputation by smoking status.
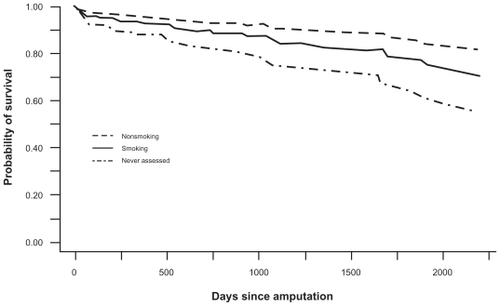
Figure 5 Model-based estimated survival curves for survival after amputation by index ABI.

Figure 6 Model-based estimated survival curves for survival after amputation by CAD history.
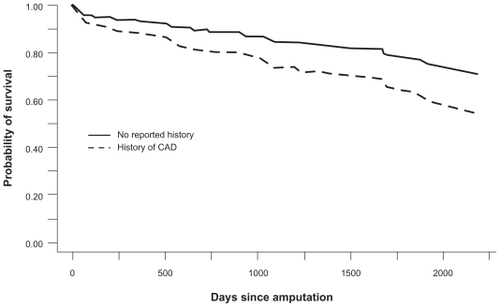
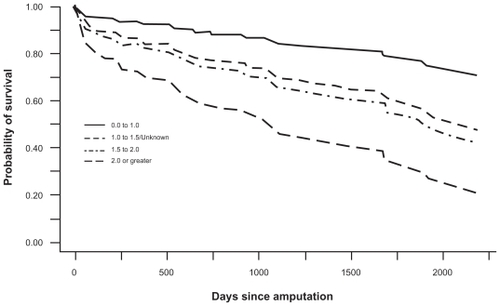
Figure 7 Model-based estimated survival curves for survival after amputation by serum creatinine.