Figures & data
Table 1. Parameter settings for comparison of the different slicers.
Table 2. Experimental plan of element dimension and spacing parameters.
The geometry output from Meshmixer is sliced in Cura and can be seen as a virtual print preview on the left. Printed strands are visualized as cylinders. An image of the printed sample is shown on the right. Some of the outer walls are removed for better view of inner structure. (A) Single sample, (B) fine sample, (C) medium sample and (D) coarse sample.
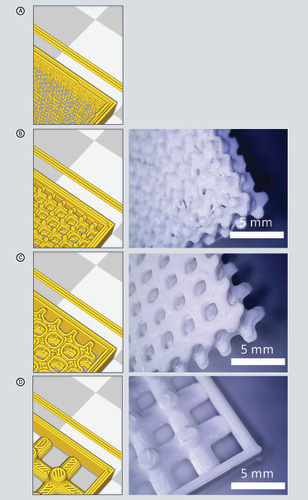
Table 3. Comparison of different slicers regarding infill structures and their modification.
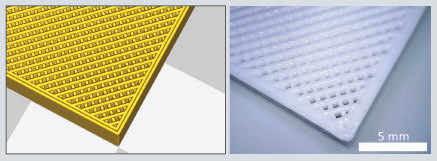
Preview of sliced output as shown in Cura on the left. Infill density is set to 50% with a rectilinear infill pattern. Isometric view of printed object on the right.
Preview of generated G-code loaded in Cura on the left (G-code data import only for visualization). Printed result with bimodal sinusoidal pattern on the right.