Figures & data
Table 1. Clinical information of 376 participants.
Table 2. The repeatability and within-laboratory precisions.
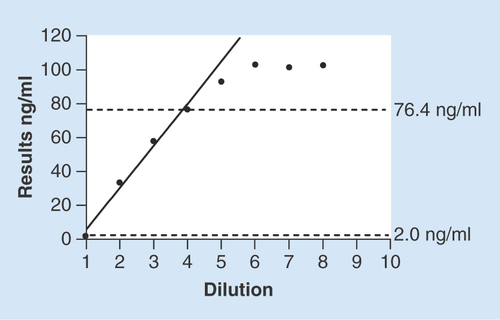
The solid line represents the linear model of four equally spaced concentration levels. Linear range of the method is 2.0–76.4 ng/ml. n = 3 per dilution level of the urine sample.
Box and whisker plots demonstrated gender-specific distributions of uAFM (A) and AfCR (B) in 121 males and 126 females. Mann–Whitney U test was used to compare differences between sex groups. The detail information was shown in Supplementary table 1.
*p < 0.05.
AfCR: Afamin–creatinine ratio; uAFM: Urine afamin.
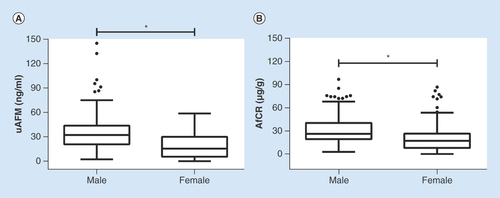
Table 3. The relationship between afamin-related variables (urine afamin and afamin–creatinine ratio) and age in two sex groups†.
Table 4. The detail results of study participants in the clinical evaluation study†‡.
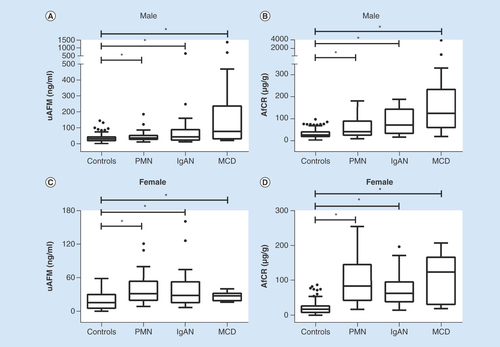
Box and whisker plots showed distribution of uAFM (A & C) and AfCR (B & D) in healthy volunteers (controls, n = 121 for males and 126 for females) compared with patients with PMN (n = 31 for males and 28 for females), IgAN (n = 22 for males and 24 for females) and MCD (n = 14 for males and 10 for females). Mann–Whitney U test was used to compare differences.
*p < 0.05.
ACR: Albumin-creatinine ratio; AfCR: Afamin–creatinine ratio; IgAN: IgA nephropathy; MCD: Minimal change disease; PMN: Primary membranous nephropathy; uAFM: Urine afamin.
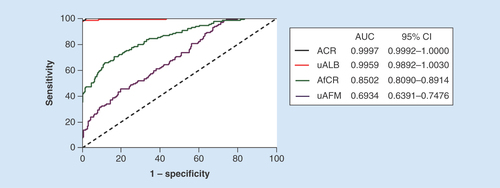
ACR: Albumin–creatinine ratio; AfCR: Afamin–creatinine ratio; AUC: Area under the curve; uAFM: Urine afamin; uALB: Urine albumin.