Figures & data
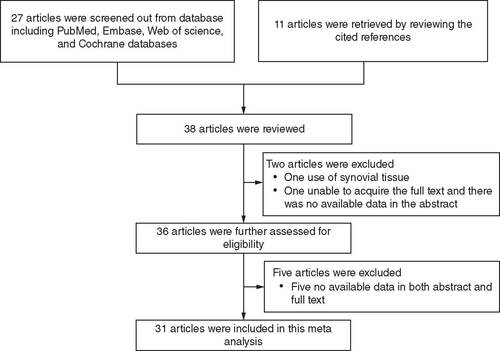
Via detailed search and screening, 38 articles were initially reviewed; after careful sorting, a total of 31 articles were included in this meta-analysis.
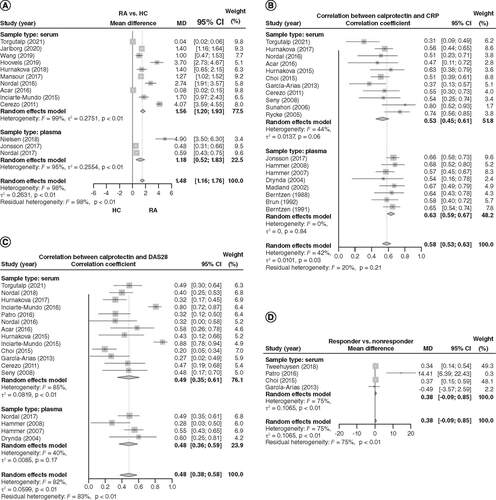
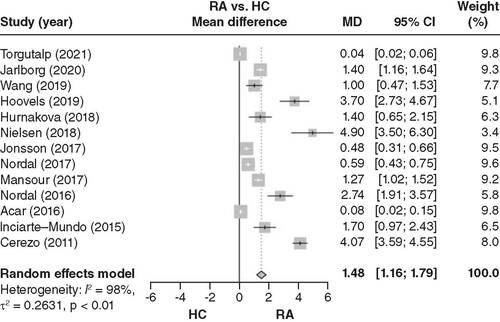
After a pooled analysis of 13 related articles, blood calprotectin levels were elevated in RA patients compared with HCs.
HC: Healthy control; RA: Rheumatoid arthritis.
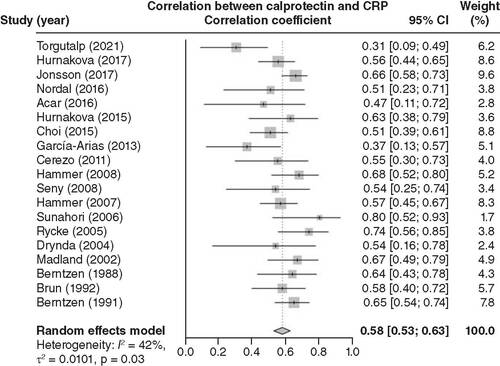
After a pooled analysis of 19 related articles, blood calprotectin level was positively related to CRP in RA patients.
CRP: C-reactive protein; RA: Rheumatoid arthritis.
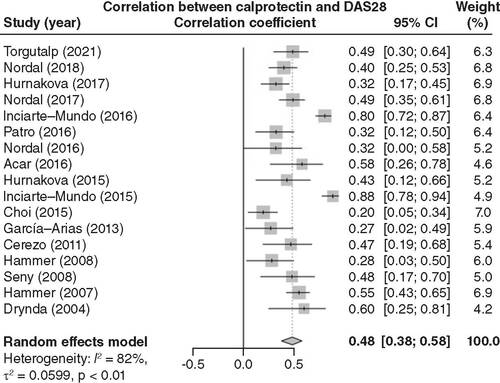
After a pooled analysis of 17 related articles, blood calprotectin levels were positively correlated with DAS28 scores in RA patients.
DAS28: Disease Activity Score for 28 joints; RA: Rheumatoid arthritis.
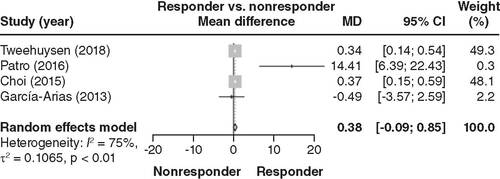
After a pooled analysis of four related articles, blood calprotectin level was not different between responders and nonresponders.
(A) Sensitivity analysis of calprotectin levels between rheumatoid arthritis patients and healthy controls. (B) Sensitivity analysis of the correlation between calprotectin levels and C-reactive protein. (C) Sensitivity analysis of the correlation between calprotectin levels and disease activity scores for 28 joints. (D) Sensitivity analysis of calprotectin level between RA responders and nonresponders.
RA: Rheumatoid arthritis.
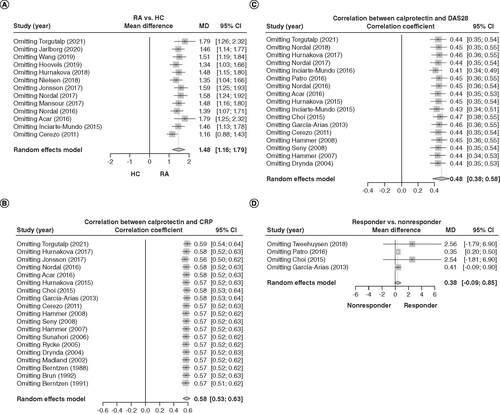
Table 1. Publication bias in key assessments.
(A) Separate analyses of the differences in serum or plasma calprotectin between rheumatoid arthritis patients and healthy controls. (B) Separate analyses of the correlation between serum or plasma calprotectin and C-reactive protein. (C) Disease activity scores for 28 joints. (D) Treatment response.