Figures & data
Table 1. Cutoff values of each inflammatory marker and their corresponding sensitivity and specificity.
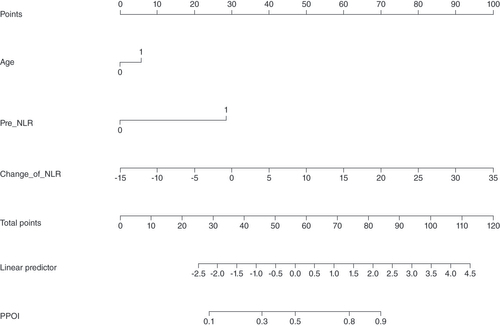
A straight line was drawn vertically from the axis of each variable toward the ‘points’ scale. The points for each variable were summed together to generate a total point score, which is projected on the bottom line to obtain the individual predictive risk of PPOI.
pre-NLR: Preoperative neutrophil-lymphocyte ratio; ΔNLR: Change of NLR, postoperative NLR – preoperative NLR.
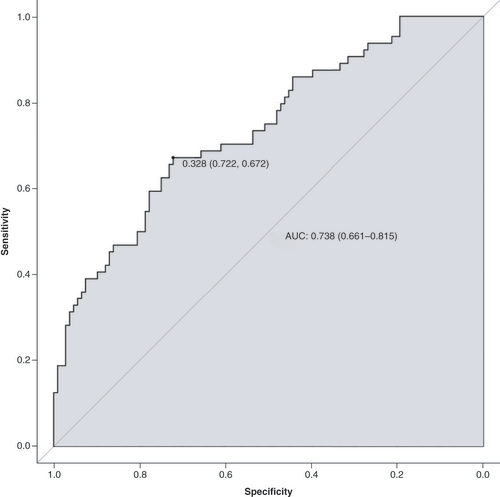
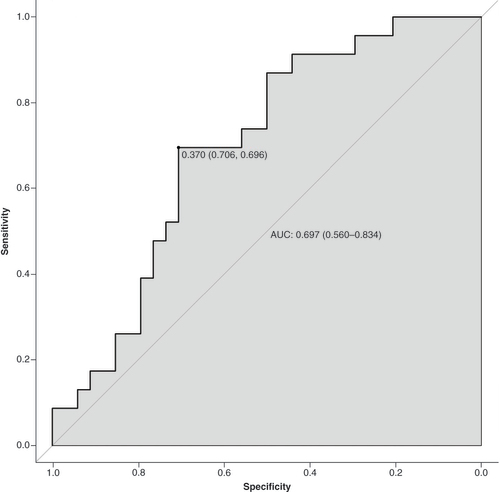
AUC: Area under the receiver operating characteristic curve; ROC: Receiver operating characteristic curve.
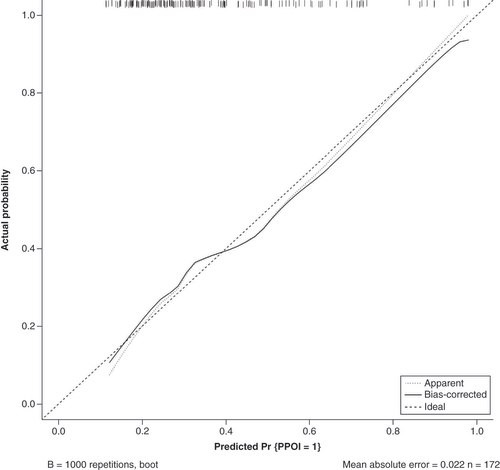
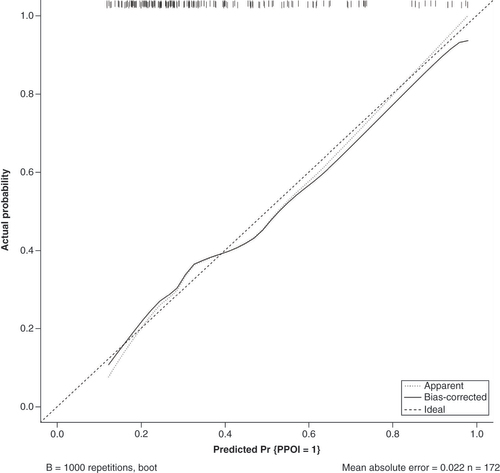
The apparent line represents actual nomogram performance. The bias-corrected line represents the bootstrap-corrected performance of the nomogram. The diagonal line is an ideal model, indicating 100% predictive power.
AUC: Area under the receiver operating characteristic curve; ROC: Receiver operating characteristic curve.
The apparent line represents actual nomogram performance. The bias-corrected line represents the bootstrap-corrected performance of the nomogram. The diagonal line is an ideal model, indicating 100% predictive power.