Figures & data
Table 1. Clinicopathological features of triple-negative breast cancer patients.
Table 2. 50 top genes differentially expressed identified in transcriptome analysis: SPARC positive versus SPARC negative – positively regulated.
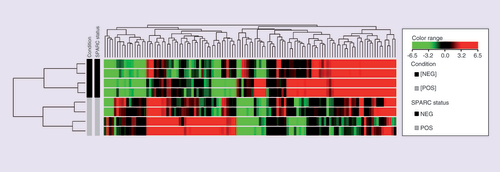
The hierarchical cluster shows the fold change inexpression of the 50 TOP upregulated genes and 50 TOP downregulated genes, using the cut off foldchange ≥ 3. Columns in heat map correspond to the samples categorized as TNBC with SPARC positive expression and good prognosis (in grey) and TNBC with SPARC negative expression and poor prognosis (in black). Transcript enrichment is encoded in the heat map in green when showing downregulation; or red when showing upregulation in the comparison of TNBC/SPARC+ vs TNBC/SPARC.
TNBC: Triple negative breast cancer; TOP: Gene expression profiling of TNBC with differences in SPARC expression.
Genes or gene products are represented as nodes, and the biological relationship betweentwo nodes is represented as an edge. The intensity of the node color indicates the degree of upregulation (red) or downregulation (green). Edges are displayed with various labels that describe the nature of the relationship between the nodes: — binding only, → acts on, Θ auto-regulation.
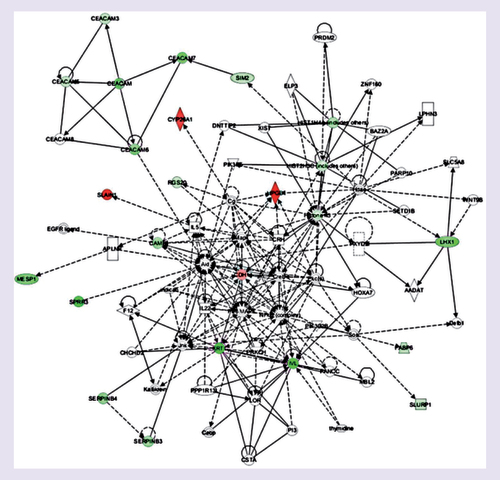
Table 3. 50 top genes differentially expressed identified in transcriptome analysis: SPARC positive versus SPARC negative – negatively regulated.
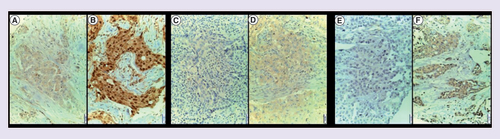
SOHLH2 protein showed nuclear and cytoplasmic staining: (A) tumor cells with cytoplasmic weak staining. (B) Nuclear and cytoplasmic positive staining of tumor cells with a discreet stromal staining. DNAJC12 protein showed cytoplasmic staining. (C) Negative staining. (D) Cytoplasmic positive staining. LIM1 protein showed cytoplasmic staining. (E) Negative staining. (F) Positive staining.
Magnification: 20x.
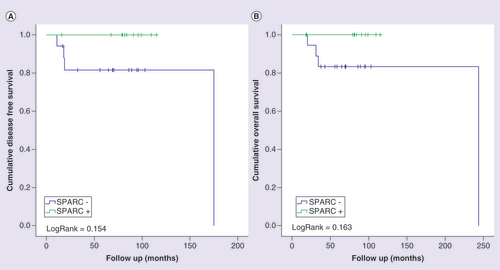
Kaplan-Meier curves for disease-free (A) and overall (B) survival of triple-negative breast cancer patients, stratified according to SPARC protein expression. Patients were categorized as positive (moderate or intense) or negative (negative or weak) according to SPARC protein immunostaining. LogRank test was performed for curves comparison.
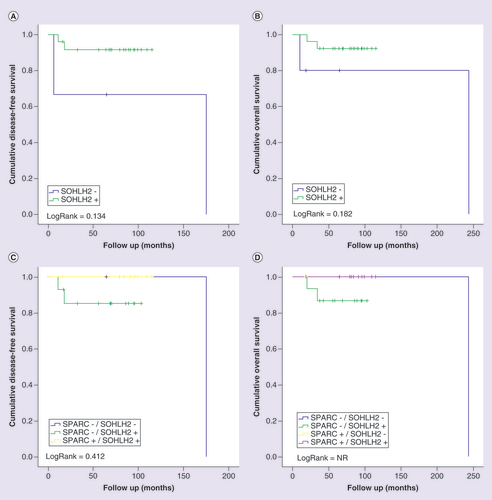
Kaplan-Meier curves for disease-free (A and C) and overall (B and D) survival of triple-negative breast cancer patients stratified according to SOHLH2 protein expression. Patients were categorized as positive (moderate orintense) or negative (negative or weak) according to SOHLH2 protein immunostaining. In (C) and (D), patients were classified in four categories according to the protein immunostaining of SPARC and SOHLH2 status. LogRank test was performed for curves comparison.
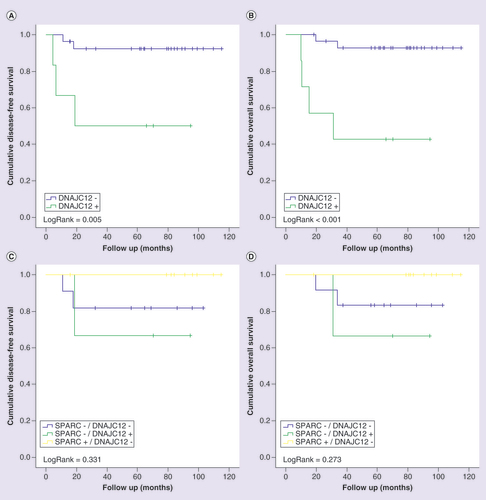
Kaplan-Meier curves for disease-free (A and C) and overall (B and D) survival of triple-negative breast cancer patients stratified according to DNAJC12 protein expression. Patients were categorized as positive (>10%) ornegative (<10%) according to the percentage of tumor cells positive to DNAJC12. In (C) and (D), patients were classified in four categories according to the protein immunostaining of SPARC and DNAJC12 status. LogRank test was performed for curves comparison.
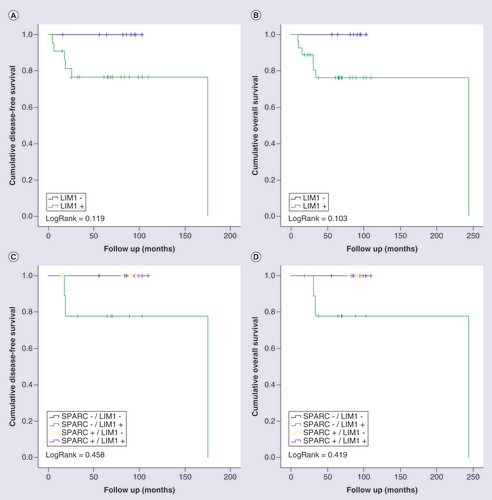
Kaplan-Meier curves for disease-free (A and C) and overall (B and D) survival of triple-negative breast cancer patients stratified according to LIM1 protein expression. Patients were categorized as positive (>10%) or negative (<10%) according to the percentage of tumor cells positive to LIM1. In (C) and (D), patients were classified in four categories according to the protein immunostaining of SPARC and LIM1 status. LogRank test was performed for curves comparison.