Figures & data
Figure 1. Flow diagram: identification of patients eligible for this analysis.
EP: Platinum–etoposide; ICD: International Classification of Diseases; N: Number.
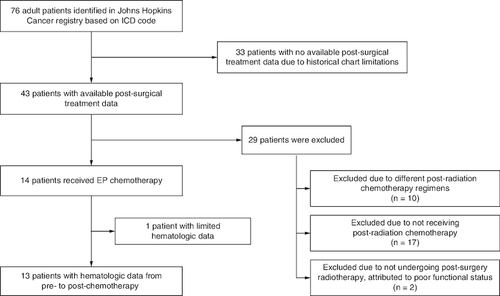
Table 1. Patient demographics.
Table 2. Clinical characteristics, treatment and outcome of patients with adult medulloblastoma treated with cisplatin and etoposide.
Figure 2. Illustration of hematological toxicity.
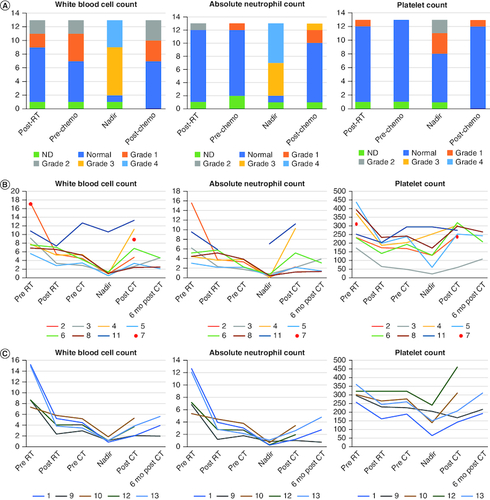
(A) Comparison of CTCAE grading of white blood cell counts, absolute neutrophil counts, and platelet counts post-craniospinal irradiation (CSI), prechemotherapy, at the count nadir and post-chemotherapy (data of photon and proton radiation therapy patients combined). (B) Blood counts during treatment over time for photon radiation therapy patients. (C) Blood counts during treatment over time for proton radiation therapy patients. Each line and color represents one individual patient.
ND: No hematological data for this time point.