Figures & data
Table 1. Characteristics of 650,382 people diagnosed with colorectal cancer by age at diagnosis (±50 years), Surveillance, Epidemiology and End Results 18, 2000–2016.
Table 2. Crude and adjusted hazard ratios demonstrating association between age at diagnosis and all-cause mortality, by tumor side, Surveillance, Epidemiology and End Results 18, 2000–2006.
Adjusted hazard ratios demonstrating association between age at diagnosis and all-cause mortality for right colon (A), left colon (B), and rectal (C) cancer, SEER 18, 2000–2016.
HR: Hazard ratio; SEER: Surveillance, Epidemiology and End Result.
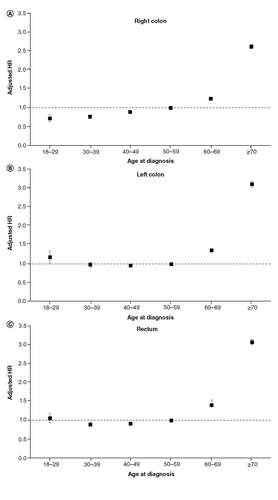
Table 3. Five-year risk (95% CI) of all-cause mortality by age at diagnosis and tumor side.
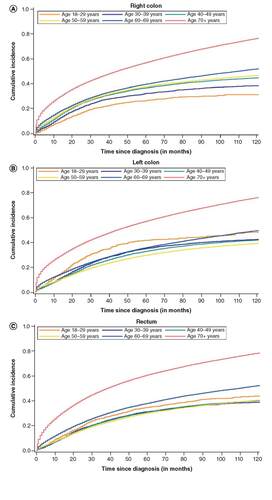
Cumulative incidence of all-cause mortality by age at diagnosis for right colon (A), left colon (B) and rectal (C) cancer, SEER 18, 2000–2016.
SEER: Surveillance, Epidemiology and End Result.