
Figures & data
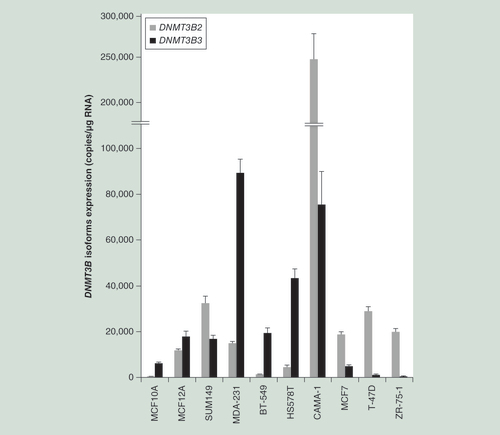
Relative mRNA expression of human DNMT3B2 (gray bar) and its alternative spliced isoform DNMT3B3 (black bar). Results are expressed in mRNA copy number corrected with the reference gene HPRT1 as mean ± SEM; n = 4.
Hierarchical clustering of parental (untransfected) cell lines based on genome-wide methylation data of each cell line. This analysis was performed with GenomeStudio calculating dissimilarities based on absolute correlation using a 1-r distance measure. Rows represent each parental (untransfected) cell line.
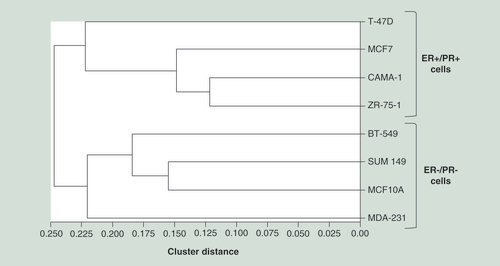
Table 1. DNMT3B3 and DNMT3B2 expression levels in untransfected and transfected/transduced breast cell lines.
Table 2. Number of CpG sites and associated genes identified as differentially methylated in ER+/PR+ breast cell lines.
Table 3. Number of differentially methylated CpG sites according to their gene location.
Table 4. Over-represented pathways, functions and diseases triggered by the overexpression of the DNMT3B3 isoform in ER+/PR+ cell lines.
Table 5. Overrepresented pathways, functions and diseases triggered by the overexpression of the DNMT3B3 isoform in ER-/PR- cell lines.
Table 6. Over-represented pathways, functions and diseases triggered by the overexpression of the DNMT3B3 isoform using affected genes commonly identified in ER+/PR+ and ER-/PR- cell lines.
Table 7. Predicted effect of DNMT3B isoform expression on relevant biological processes in ER+/PR+ cell lines.
Supplemental material