Figures & data
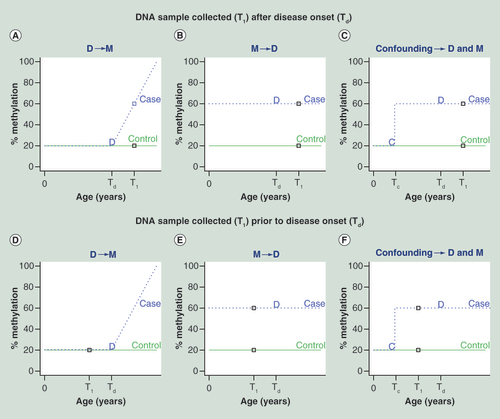
T1 and Td represent times when DNA sample is collected and disease occurred, respectively (these events are also represented with a square and ‘D’). Tc is the time when a confounding factor (e.g., environmental exposures) affects methylation (denoted with a ‘C’). In the top panel (A–C), DNA sample is collected after disease onset, we observe a positive association between methylation and disease, but cannot distinguish between each of the three scenarios D->M, M-> D and confounding. In the bottom panel (D–F), DNA sample was obtained prior to disease onset, allowing us to rule out D -> M, but both M -> D and confounding are still possibilities.