Figures & data
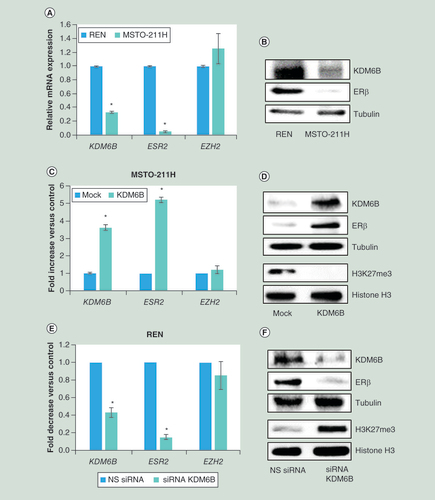
(A) Real time-PCR analyses of KDM6B, ESR2 and EZH2 mRNA in MSTO-211H compared to REN cells. 18S rRNA was used as housekeeping gene. (B) Representative western blot analysis of KDM6B and ERβ in MSTO-211H compared to REN cells. Tubulin was used as loading control. (C) Real time-PCR of KDM6B, ESR2 and EZH2 mRNA in KDM6B overexpressing MSTO-211H cells compared to their mock controls. 18S rRNA was used as housekeeping gene. (D) Representative western blot analysis of KDM6B, ERβ, H3K27me3 and total histone H3 in KDM6B overexpressing MSTO-211H cells compared to mock cells. Tubulin was used as loading control. (E) Real time-PCR analyses of KDM6B, ESR2 and EZH2 mRNA in KDM6B silenced REN cells compared to their NS siRNA controls. 18S rRNA was used as housekeeping gene. (F) Representative western blot analysis of KDM6B, ERβ, H3K27me3 and histone H3 in KDM6B silenced REN cells compared to their NS siRNA controls. Tubulin was used as loading control. Each graph is representative of three independent experiments. Each bar represents mean ± standard deviation.
*p ≤ 0.05.
ERβ: Estrogen receptor β; NS: Nonspecific control siRNA.
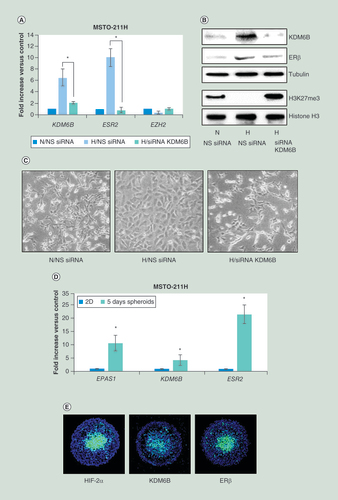
(A) Real time-PCR analyses of KDM6B, ESR2 and EZH2 mRNA in MSTO-211H cells transfected with NS siRNA or KDM6B siRNA (siRNA KDM6B) and then incubated for 48 h under N or H conditions. 18S rRNA was used as housekeeping gene. (B) Representative western blot analysis of KDM6B, ERβ, H3K27me3 and total histone H3 in MSTO-211H cells transfected with NS siRNA or KDM6B siRNA (siRNA KDM6B) and then incubated for 48 h under N or H conditions. Tubulin was used as loading control. (C) Phase contrast images (200× magnification) of MSTO-211H cells transfected with NS siRNA or KDM6B siRNA (siRNA KDM6B) and then incubated for 48 h under N or H conditions. (D) Real time-PCR analyses of EPAS1, KDM6B and ESR2 mRNA expressed by MSTO-211H grown for 5 days as spheroids (pools of 5) compared to cells grown in monolayer (2D). 18S rRNA was used as housekeeping gene. (E) Immunofluorescence analysis of HIF-2α, KDM6B and ERβ spatial distribution in MSTO-211H spheroids at day 5, evidenced by fluorescein isothiocyanate-conjugated secondary Abs.
Each graph is representative of three independent experiments. Each bar represents mean ± standard deviation.
*p ≤ 0.05.
ERβ: Estrogen receptor β; H: Hypoxic; N: Normoxic; NS: Nonspecific control siRNA.
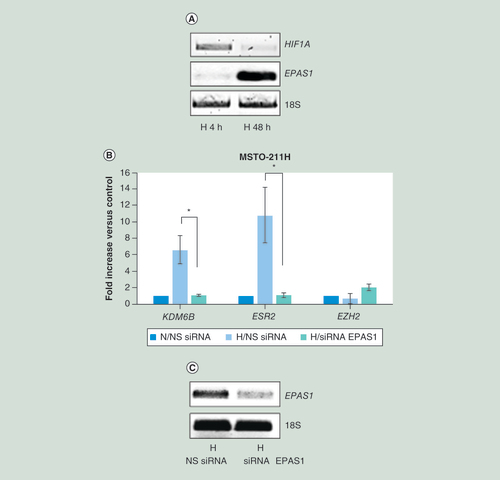
(A) Representative quantitative real time-PCR analysis of HIF1A and EPAS1 in MSTO-211H cells cultured 4 or 48 h under H conditions. 18S rRNA was used as housekeeping gene. (B) Real time-PCR analyses of KDM6B, ESR2 and EZH2 mRNA in MSTO-211H cells transfected with NS siRNA or EPAS1 siRNA (siRNA EPAS1) and then incubated for 48 h under N or H conditions. 18S rRNA was used as housekeeping gene. (C) Representative quantitative real time-PCR analysis of EPAS1 in MSTO-211H cells transfected with NS siRNA or EPAS1 siRNA (siRNA EPAS1). 18S rRNA was used as housekeeping gene. Graph is representative of three independent experiments. Each bar represents mean ± standard deviation.
*p ≤ 0.05.
H: Hypoxic; N: Normoxic; NS siRNA: Nonspecific control siRNA.
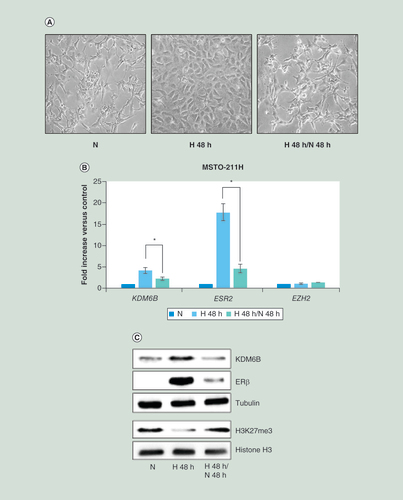
(A) Phase contrast images (200× magnification) of MSTO-211H cells grown 48 h under N or H conditions or recovered 48 h in normoxia after hypoxia. (B) Real time-PCR analyses of KDM6B, ESR2 and EZH2 mRNA in MSTO-211H cells grown 48 h under N or H conditions or recovered 48 h in normoxia after hypoxia. 18S rRNA was used as housekeeping gene. (C) Representative western blot analysis of KDM6B, ERβ, H3K27me3 and total histone H3 in MSTO-211H cells grown 48 h under N or H conditions or recovered 48 h in normoxia after hypoxia. Tubulin was used as loading control. Graph is representative of three independent experiments. Each bar represents mean ± standard deviation.
*p ≤ 0.05.
ERβ: Estrogen receptor β; H: Hypoxic; N: Normoxic.
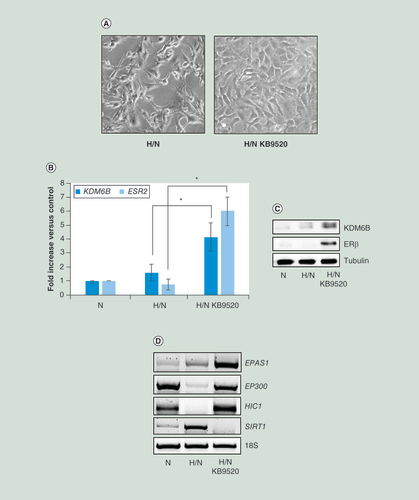
(A) Phase contrast images (200× magnification) of MSTO-211H cells recovered 48 h in normoxia after 48 h in hypoxia (H/N) ± 10 nM KB9520. (B) Real time-PCR analyses of KDM6B and ESR2 mRNA in MSTO-211H cells grown 48 h under normoxic conditions or recovered 48 h in normoxia after hypoxia (H/N) ± 10 nM KB9520. 18S rRNA was used as housekeeping gene. (C) Representative western blot analysis of KDM6B and ERβ expression in MSTO-211H cells recovered 48 h in normoxia after hypoxia (H/N) ± 10 nM KB9520. Tubulin was used as loading control. (D) Representative quantitative real time-PCR analysis of EPAS1, EP300, HIC1 and SIRT1 in MSTO-211H cells grown 48 h under normoxic conditions or recovered 48 h in normoxia after hypoxia (H/N) ± 10 nM KB9520. 18S rRNA was used as housekeeping gene. Graph is representative of three independent experiments. Each bar represents mean ± standard deviation.
*p ≤ 0.05.
ERβ: Estrogen receptor β; H: Hypoxic; N: Normoxic.