Figures & data
(A) [3H]-DAMGO saturation binding at the three selected brain areas (framed in the matrix plot below) thalamus medialis, basolateral amygdala and nucleus pontis (means and SDs). The number of μ-opioid receptors (Bmax) was calculated by fitting a nonlinear model (lines) to the data as: B([3H]DAMGO) = (Bmax([3H]DAMGO) · F([3H]DAMGO))/(KD([3H]DAMGO) + F([3H]DAMGO)), where B([3H]DAMGO) denotes the concentration of μ-opioid receptor bound [3H]DAMGO (specific binding), F([3H]DAMGO) the concentration of the free [3H]DAMGO, Bmax([3H]DAMGO) the maximum number of [3H]DAMGO binding sites (μ-opioid receptor density) and KD([3H]DAMGO) the equilibrium dissociation constant of [3H]DAMGO. (B) Matrix plot of the Bmax values indicating μ-opioid receptor expression observed in the 21 brain areas of 27 subjects. Cells are color coded from red to yellow according to opioid receptor expression, with red indicating lowest and yellow indicating highest expression and white cells indicate missing data.
([3H]DAMGO): 3H-[D-Ala2,N-MePhe4,Gly-ol5]-enkephalin; B([3H]-DAMGO): The concentration of μ-opioid receptor bound [3H]-DAMGO (specific binding); Bmax([3H]-DAMGO): The maximum number of [3H]-DAMGO binding sites (μ-opioid receptor density); F([3H]-DAMGO): The concentration of the free [3H]-DAMGO; KD([3H]-DAMGO): The equilibrium dissociation constant of [3H]-DAMGO; Bmax: The number of μ-opioid receptors.
![Figure 1. Expression of μ-opioid receptors across 21 different human brain regions, analyzed from tissue acquired postmortem from 27 former heroin addicts. (A) [3H]-DAMGO saturation binding at the three selected brain areas (framed in the matrix plot below) thalamus medialis, basolateral amygdala and nucleus pontis (means and SDs). The number of μ-opioid receptors (Bmax) was calculated by fitting a nonlinear model (lines) to the data as: B([3H]DAMGO) = (Bmax([3H]DAMGO) · F([3H]DAMGO))/(KD([3H]DAMGO) + F([3H]DAMGO)), where B([3H]DAMGO) denotes the concentration of μ-opioid receptor bound [3H]DAMGO (specific binding), F([3H]DAMGO) the concentration of the free [3H]DAMGO, Bmax([3H]DAMGO) the maximum number of [3H]DAMGO binding sites (μ-opioid receptor density) and KD([3H]DAMGO) the equilibrium dissociation constant of [3H]DAMGO. (B) Matrix plot of the Bmax values indicating μ-opioid receptor expression observed in the 21 brain areas of 27 subjects. Cells are color coded from red to yellow according to opioid receptor expression, with red indicating lowest and yellow indicating highest expression and white cells indicate missing data.([3H]DAMGO): 3H-[D-Ala2,N-MePhe4,Gly-ol5]-enkephalin; B([3H]-DAMGO): The concentration of μ-opioid receptor bound [3H]-DAMGO (specific binding); Bmax([3H]-DAMGO): The maximum number of [3H]-DAMGO binding sites (μ-opioid receptor density); F([3H]-DAMGO): The concentration of the free [3H]-DAMGO; KD([3H]-DAMGO): The equilibrium dissociation constant of [3H]-DAMGO; Bmax: The number of μ-opioid receptors.](/cms/asset/31929301-ff23-4a0c-9619-bf27716c791e/iepi_a_12325092_f0001.jpg)
(A) Shows a projection of the log-transformed 21 × 27 Bmax matrix onto a toroid neuronal grid where opposite edges are connected and using large numbers of nodes (4100). The dots indicate the so-called ‘best matching units’ of the self-organizing map, which are those neurons whose weight vector is most similar to the input. Neurons of the original 50 × 82 grid that do not match any input respectively brain regions are omitted. To the BMUs, the brain regions represented by them are annotated. The BMUs are colored according to the obtained classification respectively clustering of the data space. This cluster structure emerged from visualization of the distances between neurons in the high-dimensional space by means of a U-Matrix [Citation22]. The U-Matrix was cut from a tiled display of the emergent self-organizing map to remove duplicate representation of the data. It was colored as a geographical map with brown or snow-covered heights and green valleys. Thus, valleys indicate clusters of similar brain regions. The watersheds of the U-Matrix indicate borderlines of clusters, which can be seen on the 3D-display of U-matrix shown below the (A) and which can be used as a haptic presentation of high-dimensional data by means of 3D-printing [Citation43]. Between (A) and 3D views of the U*-matrix (B), the cluster differences with respect to the Bmax values are shown as box and whisker plot constructed using the minimum, quartiles, median (solid horizontal line within the box) and maximum of the data, with the notches displaying a confidence interval around the median. The boxes are colored according to the BMUs cluster coloring in the self-organizing map.
BMU: Best matching unit.
![Figure 2. Pattern of μ-opioid receptor expression across 21 pain and addiction relevant areas of the human brain, analyzed from tissue acquired postmortem from 27 former heroin addicts. (A) Shows a projection of the log-transformed 21 × 27 Bmax matrix onto a toroid neuronal grid where opposite edges are connected and using large numbers of nodes (4100). The dots indicate the so-called ‘best matching units’ of the self-organizing map, which are those neurons whose weight vector is most similar to the input. Neurons of the original 50 × 82 grid that do not match any input respectively brain regions are omitted. To the BMUs, the brain regions represented by them are annotated. The BMUs are colored according to the obtained classification respectively clustering of the data space. This cluster structure emerged from visualization of the distances between neurons in the high-dimensional space by means of a U-Matrix [Citation22]. The U-Matrix was cut from a tiled display of the emergent self-organizing map to remove duplicate representation of the data. It was colored as a geographical map with brown or snow-covered heights and green valleys. Thus, valleys indicate clusters of similar brain regions. The watersheds of the U-Matrix indicate borderlines of clusters, which can be seen on the 3D-display of U-matrix shown below the (A) and which can be used as a haptic presentation of high-dimensional data by means of 3D-printing [Citation43]. Between (A) and 3D views of the U*-matrix (B), the cluster differences with respect to the Bmax values are shown as box and whisker plot constructed using the minimum, quartiles, median (solid horizontal line within the box) and maximum of the data, with the notches displaying a confidence interval around the median. The boxes are colored according to the BMUs cluster coloring in the self-organizing map.BMU: Best matching unit.](/cms/asset/32c143fc-1f3e-47d5-a9fa-2d0c284df256/iepi_a_12325092_f0002.jpg)
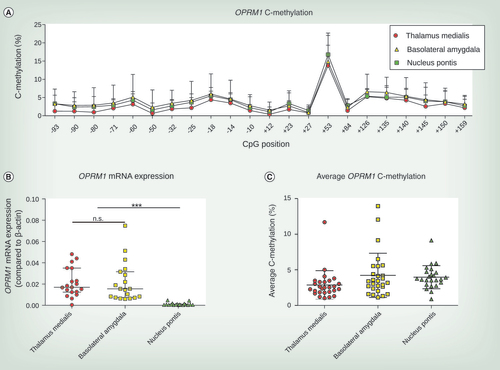
(A) C-methylation profile across OPRM1 gene from CpG position -93 to +159. Mean and SD from 24 to 27 brain tissue samples are shown. (B) OPRM1 mRNA expression compared with β-actin differed in brain tissue of thalamus medialis, basolateral amygdala and nucleus pontis (Kruskal–Wallis χ2 = 34.81, df = 2, p < 2.8 × 10⁻⁸). Whereas thalamus medialis and basolateral amygdala showed no differences in OPRM1 mRNA expression, both regions significantly showed significantly higher OPRM1 mRNA expression levels than those found in nucleus pontis (Dunn’s tests: ***p < 0.001, n.s.). Experiments were conducted from 19 brain tissue samples and median and interquartile ranges are shown. (C) Average OPRM1 C-methylation of thalamus medialis, basolateral amygdala and nucleus pontis. Median and interquartile ranges are shown conducted from 24 to 27 brain tissue samples for each brain region.
n.s.: Not significant.
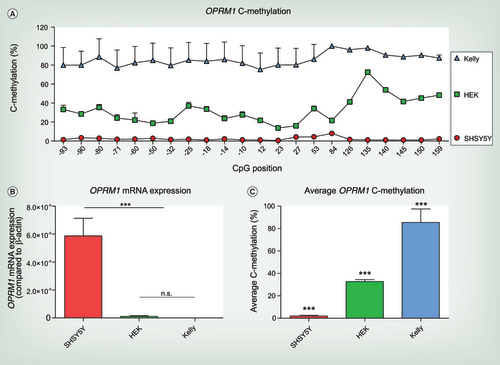
(A) C-methylation profile across OPRM1 gene from CpG position -93 to +159. Significant differences between different cell lines were assessed using rm-ANOVA with ‘CpG position’ as within-subject factor and cell type as between-subjects factor (main effect ‘cell line’ df = 2, F = 192.2, p = 2.04 × 10⁻¹¹ and ‘CpG position’ df = 20, F = 28.015, p = 1.4 × 10⁻⁵ and a significant interaction ‘cell line’ by ‘CpG position’ df = 40, F = 13.455, p = 9.5 × 10⁻⁵). (B) OPRM1 mRNA expression of the untreated cell lines SHSY5Y, HEK-293 and Kelly. OPRM1 mRNA expression is significantly higher in SHSY5Y cells compared with HEK-293 and Kelly cells, that do not express μ-opioid receptors (one-way ANOVA df = 2, F = 63.72, p < 0.0001; n.s. no significant difference between HEK-293 and Kelly cells, ***p < 0.001 for both HEK-293 and Kelly vs SHSY5Y). OPRM1 mRNA expression compared with β-actin from three independent samples are shown as mean ± SD. (C) Average OPRM1 C-methylation of SHSY5Y, HEK-293 and Kelly cells. Significant differences between the cell lines were assessed using one-way ANOVA (df = 2, F = 216.7, p < 0.001) and post hoc t-test with Bonferroni α correction (all p < 0.001). Experiments were performed from six independent cell samples and are shown as mean + SD.
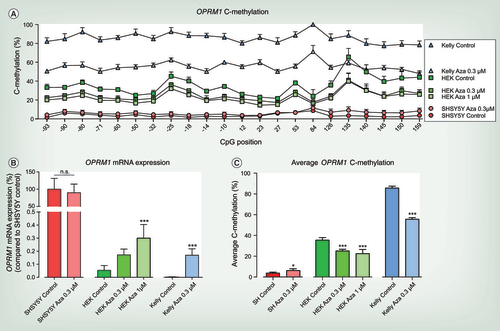
(A) C-methylation profile across OPRM1 gene from CpG position -93 to +159 of 5-Aza-2-desoxy-cytidine (5-Aza-CdR) treated and untreated SHSY5Y, HEK-293 and Kelly cells. Significant differences for each condition (cell line and treatment condition) were assessed using rm-ANOVA with ‘CpG position’ as within-subject factor and ‘condition’ as between-subjects factor (main effect ‘condition’ df = 6, F = 754.02, p = 1.32 × 10⁻²⁹ and ‘CpG position’ df = 21, F = 58.123, p = 5.2 × 10⁻¹⁶ and interaction ‘condition’ by ‘CpG position’ df = 126, F = 18.416, p = 4.76 × 10⁻¹⁷) and post hoc t-Test with Bonferroni α correction (Kelly Control vs Kelly Aza) 0.3 μM (p = 6.55 × 10⁻¹⁷), HEK-293 Control versus HEK-293 Aza 0.3 μM (p = 2.1 × 10⁻⁵) and versus HEK-293 Aza 1 μM (p = 6.6 × 10⁻⁹), SHSY5Y Control versus SHSY5Y Aza 0.3 μM (n.s.)). (B) OPRM1 mRNA expression of 5-Aza-CdR treated and untreated SHSY5Y, HEK-293 and Kelly cells. OPRM1 mRNA expression is compared with SHSY5Y cells under control condition that were set as 100% to display different OPRM1 mRNA expression levels between cell lines. OPRM1 mRNA expression of 5-Aza-CdR treated HEK-293 and Kelly cells cannot reach OPRM1 expression levels of μ-opioid receptor positive SHSY5Y cells. To display the influence of 5-Aza-CdR treatment on OPRM1 mRNA expression for each cell line, 5-Aza-CdR treatment was compared with the respective control condition of the particular cell line. No significant differences were observed in OPRM1 mRNA expression in SHSY5Y cells following 5-Aza-CdR treatment (unpaired t-test p = 0.58). OPRM1 mRNA expression is significantly upregulated in HEK-293 cells following treatment with 1 μM 5-Aza-CdR (one-way ANOVA df = 2, F = 16.8, p = 0.0003; post hoc t-test ***p < 0.001). OPRM1 expression is significantly upregulated in Kelly cells following treatment with 0.3 μM 5-Aza-CdR (unpaired t-test ***p < 0.001). (A–C) At least three to six experiments were performed for each condition and are shown as mean plus SD. (C) Average OPRM1 C-methylation of 5-Aza-CdR treated and untreated SHSY5Y, HEK-293 and Kelly cells. Significant differences were assessed by comparing the 5-Aza-CdR treatment with the respective control condition of the particular cell line. Average OPRM1 methylation was significantly decreased following 5-Aza-CdR treatment in Kelly (unpaired t-test ***p < 0.001) and HEK-293 cells (one-way ANOVA df = 2, F = 28.17, p < 0.0001; post hoc t-test ***p < 0.001). In SHSY5Y cells 5-Aza-CdR treatment slightly increases the average OPRM1 methylation (unpaired t-test p = 0.0245) which was not significant when all CpG positions were considered (rm-ANOVA).