Figures & data
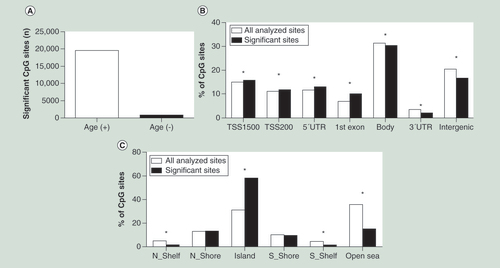
(A) Number of positive and negative correlations of CpG sites significantly associated with age in human liver. (B) Distribution of significant CpG sites compared with all analyzed CpG sites in relation to gene regions, in other words, TSS1500 (200–1500 bp upstream of TSS), TSS200 (200 bp immediate upstream of TSS), 5′UTR, first exon, 3′UTR and intergenic regions (not annotated to any of the regions). (C) Distribution of significant CpG sites compared with all analyzed CpG sites in relation to CpG islands, in other words, N_shore/S_shore (2 kb immediate upstream/downstream of CpG island), N_shelf/S_shelf (2 kb immediate downstream/upstream of shore regions), CpG island and open sea (not annotated to any of these regions).
*p < 0.05. p-values were corrected using Bonferroni correction.
+: Positive association; -: Negative association; N_Shelf: Northern shelf; N_Shore: Northern shore; S_Shelf: Southern shelf; S_Shore: Southern shore; TSS: Transcription start site; UTR: Untranslated region.
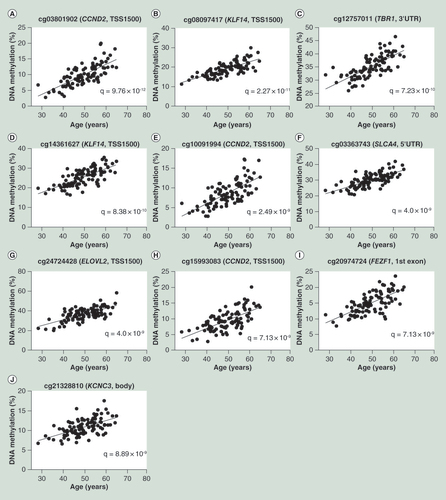
(A) Correlation of top most significant CpG site, cg03801902 of CCND2 and age. (B–J) Correlations of the remaining nine top CpG sites.
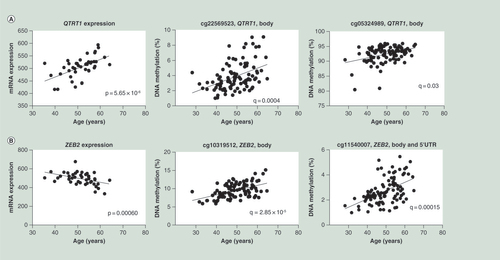
(A) Correlations between age and mRNA expression as well as DNA methylation of QTRT1. (B) Correlations between age and ZEB2 mRNA expression as well as DNA methylation of two CpG sites annotated to ZEB2.
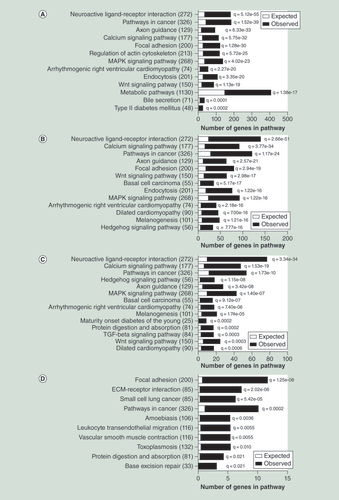
(A) Selected significantly enriched KEGG pathways of the genes with age-associated methylation changes in human liver (Bonferroni adjusted q < 0.05); complete list is presented in Supplementary Table 9). (B) Significant KEGG pathways of the genes with age-associated methylation changes of CpG sites located in CpG islands. (C) Significant KEGG pathways of genes with age-associated methylation changes of shared CpG sites for human liver, blood and adipose tissue. (D) Significant KEGG pathways of the genes with age-associated expression and methylation changes in human liver.
ECM: Extracellular matrix.
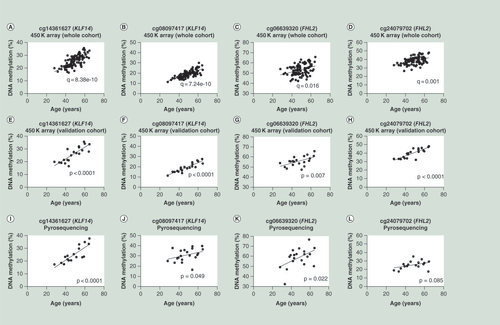
(A–D) Correlations between age and DNA methylation of CpG sites cg14361627, cg08097417, cg06639320 and cg24079702 generated by 450K array for the whole cohort (n = 95). (E–H) Correlations between age and DNA methylation of CpG sites cg14361627, cg08097417, cg06639320 and cg24079702 generated by 450K array for the validation cohort (n = 20). (I–L) Correlations between age and DNA methylation of CpG sites cg14361627, cg08097417, cg06639320 and cg24079702 generated by pyrosequencing assay. The data in the figures (E–L) were analyzed by Spearman r (two tailed).