
Figures & data
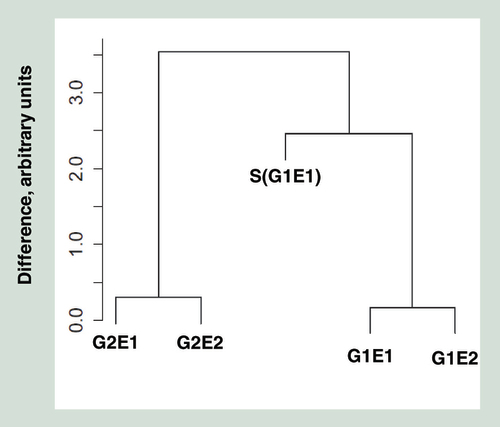
These probes are highly polymorphic SNPs, intended for analyzing relatedness between individuals. The y-axis represents arbitrary units of differences between individuals. Monozygotic pairs are coded as in the text.
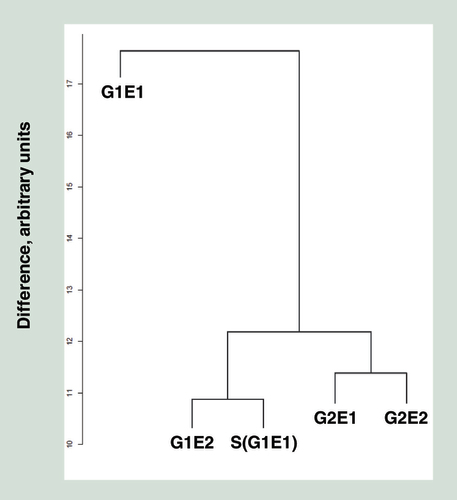
Individuals are labeled the same way as .
These are based on M values of 150,678 probes. Although we have a low sample size, genetics appears to be best represented by PC1 and rearing environment by PC3. Individuals are labeled the same say as .
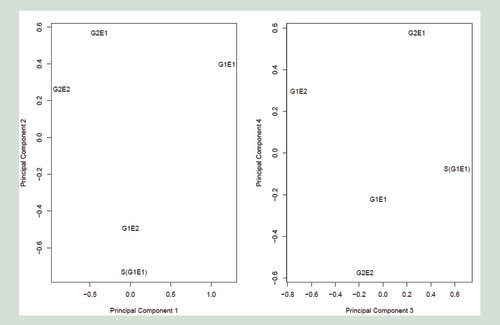
Table 1. Between individual intraclass correlation coefficients analysis of twins across 150,678 probes.
Table 2. REVIGO terms with log10p value less than -1.3 and associated GO terms.
Supplemental material