Figures & data
Dietary factors able to influence this pathway are highlighted in red, enzymes driving biological reactions are highlighted in blue/bold. The influence of methotrexate on this pathway through the inhibition of dihydrofolate reductase enzyme is highlighted in red/italics. Additional abbreviations: DHF, THF, SHMT, MTRR, MTHFR, BHMT, CBS, COMT, DNMT, SAH.
BHMT: Betaine-homocysteine S-methyltransferase; CBS: Cystathione beta synthase; COMT: cystathionine beta synthase; DHF: Dihydrofolate; DHFR: Dihydrofolate reductase; DNMT: DNA methyltransferase; MTHFR: Methylenetetrahydrofolate reductase; MTRR: Methionine synthase reductase; MTX: Methotrexate; SAH: S-adenosylhomocysteine; SAM: S-adenosylmethionine; SHMT: Serine hydroxymethyltransferase; THF: Tetrahydrofolate.
Modified with permission from [Citation1] (2011).
![Figure 1. Summary diagram of the main pathways involved in cellular one-carbon metabolism including the production of S-adenosylmethionine for methylation of DNA.Dietary factors able to influence this pathway are highlighted in red, enzymes driving biological reactions are highlighted in blue/bold. The influence of methotrexate on this pathway through the inhibition of dihydrofolate reductase enzyme is highlighted in red/italics. Additional abbreviations: DHF, THF, SHMT, MTRR, MTHFR, BHMT, CBS, COMT, DNMT, SAH.BHMT: Betaine-homocysteine S-methyltransferase; CBS: Cystathione beta synthase; COMT: cystathionine beta synthase; DHF: Dihydrofolate; DHFR: Dihydrofolate reductase; DNMT: DNA methyltransferase; MTHFR: Methylenetetrahydrofolate reductase; MTRR: Methionine synthase reductase; MTX: Methotrexate; SAH: S-adenosylhomocysteine; SAM: S-adenosylmethionine; SHMT: Serine hydroxymethyltransferase; THF: Tetrahydrofolate.Modified with permission from [Citation1] (2011).](/cms/asset/0f41aa65-4226-43a2-b884-d98a497e200d/iepi_a_12325309_f0001.jpg)
The experiment was carried out in triplicate for each cell line, resulting in an n = 9 per group to investigate the main effects of MTX and vitamin B12 treatments alone, and n = 3 to investigate the interaction between treatments.
MTX: Methotrexate.
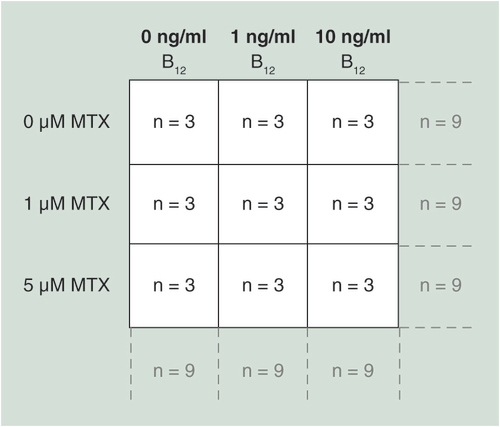
Table 1. Primer sequences and PCR and Pyrosequencing® conditions.
Cells were seeded in T25 cm2 flasks at the following starting densities (total cell number): MO3.13 and DAOY; 1 × 10⁵ - SH-SY5Y - 2 × 10⁵. Data were analyzed using univariate ANOVA, n = 9 per treatment group for main effects (i.e., MTX and vitamin B12 treatments) and n = 3 for interaction, error bars represent 95% CIs. P-values relate to effect of treatment on methylation; where groups do not share the same letter post hoc tests revealed significant differences (p > 0.05).
MTX: Methotrexate.
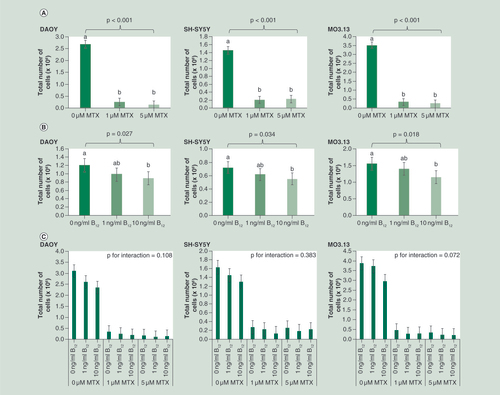
Figure 4. Effect of MTX treatment on (A) LINE1 (B) HOXA4 and (C) FKBP5 DNA methylation in DAOY, SH-SY5Y and MO3.13 cells. Data were analyzed using univariate ANOVA, n = 9 per treatment group*, error bars represent 95% CIs. P-values relate to effect of treatment on methylation; where groups do not share the same letter post hoc tests revealed significant differences (p > 0.05). (*with the exception of HOXA4 methylation in MO3.13 cells where n = 7, 9 and 8 respectively for 0, 1 and 5 μM MTX groups).
MTX: Methotrexate.
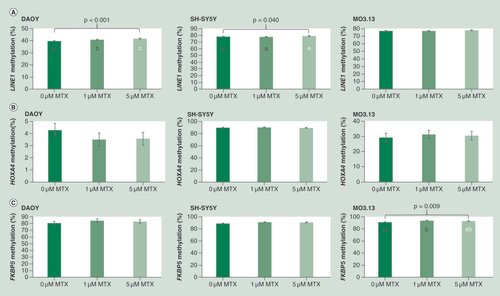
Table 2. Methylation at all investigated loci in response to vitamin B12 treatment in DAOY, SH-SY5Y and MO3.13 cells.
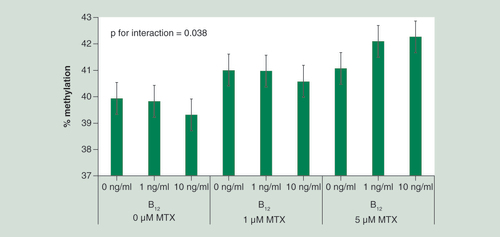
n = 3 per treatment group. Data were analyzed using univariate ANOVA, p = 0.038 for interaction between MTX and vitamin B12 treatments. Error bars represent 95% CIs.
MTX: Methotrexate.