Figures & data
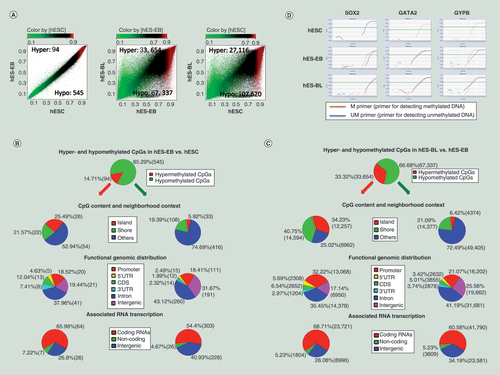
(A) Scatter plots comparing averaged beta-values from DNA methylation microarrays for 450,000 CpG sites in three cell types. Hyper-CpGs and hypo-CpGs were shown in the upper-left and lower-right areas, respectively. Differentially methylated CpG sites were filtered based on a Diff-score = ±13 (equal to p = 0.05) in hES-EBs (n = 3) versus human embryonic stem cells (hESCs) (n = 3), a Diff-score = ± 20 (equal to p = 0.01) in hES-BLs (n = 4) versus hES-EBs, or a Diff-score = ±30 (equal to p = 0.001) in hES-BLs versus hESCs. (B) DNA methylation portrait in hES-EBs versus hESCs. The following key features were depicted: percentage of hypermethylation (red) or hypomethylation (green), the CpG content and neighborhood context, the distribution of hyper-CpGs or hypo-CpGs according to the functional genome distribution and the associated RNA transcription (Bonferroni corrected one-sided Fisher’s exact p < 0.01). (C) DNA methylation portrait in hES-BLs versus hES-EBs. (D) Amplification plot of real-time MSP for SOX2, GATA2 and GYPB genes were performed in three cell samples. △Ct ≥5 represents a high level of methylated/unmethylated differentiation. Products were obtained primers only, suggesting that CpG sites in the promoter are hypermethylated, conversely, if only UM primers get their products represents the CpG sites in the promoter are unmethylated. If PCR was successful with both of primer for detecting methylated DNA (M) and primer for detecting unmethylated DNA (UM), the CpG sites are methylated partially.
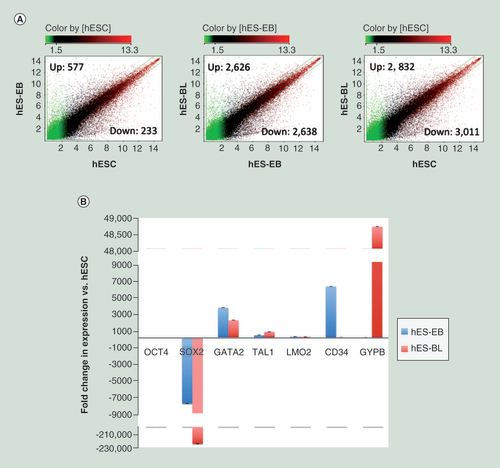
(A) Scatter plots comparing the averaged normalized log2 signal values from expression microarrays between two samples, such as hES-EBs (n = 3) versus hESCs (n = 3), or hES-BLs (n = 3) versus hES-EBs or hES-BLs versus hESCs. A fold-change >2 or <0.5 represents upregulated or downregulated genes, respectively. (B) The real-time PCR validation of down-/upregulated genes during every stage of erythroid cell differentiation. Using the comparative Ct method and GAPDH as an endogenous control, the fold-change in expression was calculated as 2(-ΔΔCt). The negative fold-difference data were converted to linear ‘fold-change in expression’ values using the following formula: linear fold change in expression = -1/2(-ΔΔCt).
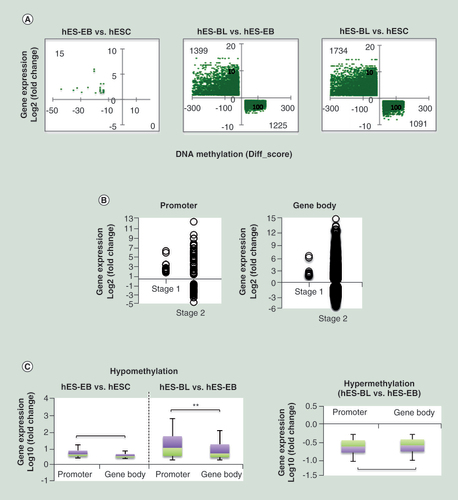
(A) A cross-plot of the combined genes showing a negative correlation between methylation and gene expression levels. The left-upper region indicates hypomethylated and upregulated genes; the right-lower region indicates hypermethylated and downregulated genes. The Y-axis was plotted based on fold-change; the X-axis was plotted based on Diff-score. (B) Correlations between the differentially methylated CpG sites distribution and gene expression during stage one (hES-EB vs hESC) and stage two (hES-BL vs hES-EB) were investigated. (C) Focusing on hypo-CpGs and hyper-CpGs, we analyzed the correlations between gene expression and differentially methylated CpG sites in the promoter or gene body.
**p < 0.01.
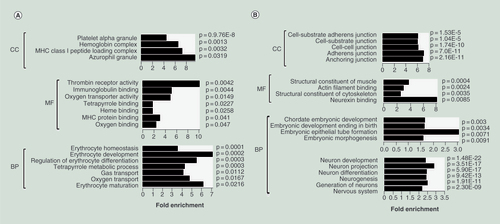
(A) Enrichment of the gene ontology (GO) terms for hypomethylated/upregulated genes in hES-BLs versus hES-EBs. Histograms were drawn using R14.0 with GO_ID as the y-axis and −log10 (p) as the x-axis. The p-values are listed next to bars, while fold-enrichment is shown below the bars. (B) Enrichment of the GO terms for hypermethylated/downregulated genes in hES-BLs versus hES-EBs.
BP: Biological process; CC: Cellular component; MF: Molecular function.
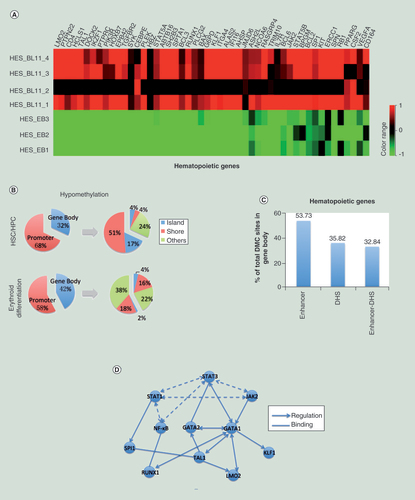
(A) Heatmap showing the hypomethylated/upregulated genes in hES-BLs (n = 4) versus hES-EBs (n = 3). (B) A pie chart showing the distribution of hypomethylated CpG sites in genes involved in hematopoietic stem cell/hematopoietic progenitor cell and erythroid differentiation. The promoters and gene bodies were investigated first, and then CpG islands, shores and others (shelves and open sea) were investigated within the promoters or gene bodies. (C) The enrichment of enhancers and DNase I-hypersensitive sites for differentially methylated CpG sites within the gene body. (D) The nodes in the network represent the anticorrelated genes. Dotted lines connect the genes of JAK-STAT-NF-κB pathway; solid lines link the pathway with target genes. The arrows point to downstream of the regulation point, and the straight lines represent binding to each other.