Figures & data
Table 1. Differentially methylated loci in peripheral blood mononuclear cells associated with Montreal Cognitive Assessment.
Table 2. Differentially methylated loci in peripheral blood mononuclear cells associated with Montreal Cognitive Assessment.
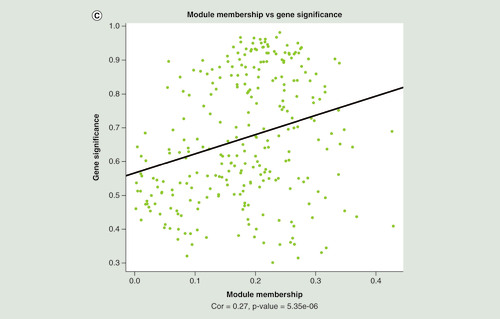
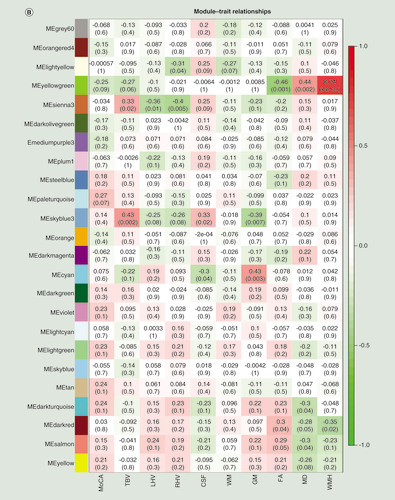
(A) Manhattan plot of differentially methylated regions (DMRs) associated with Montreal Cognitive Assessment. Red dots indicate the chromosomal location of individual probes within each DMR. The University of California Santa Cruz gene symbols corresponding to DMRs with more than three probes after Sidak correction for multiple testing are assigned to the chromosomal locations. (B) Heatmap of module–trait correlations for the remaining 24 modules, after excluding modules with significant association with the covariates of cell composition, batch, age, gender, smoking and IQ. Shown are the correlations of Montreal Cognitive Assessment, total brain volume, left hippocampal volume, right hippocampal volume, cerebrospinal fluid volume, white matter volume, gray matter volume, fractional anisotropy, mean diffusivity and white matter hyperintensities with each module. For each module–trait pair the upper value is the Pearson correlation coefficient, while the lower (bracketed) value is the correlation p-value. The cell color represents the strength and direction of the correlation. Modules are assigned an arbitrary color by the analysis software according to their size. (C) The correlation between module membership and gene significance for each probe in the ‘yellowgreen’ module.
CSF: Cerebrospinal fluid volume; FA: Fractional anisotropy; GM: Grey matter volume; LHV: Left hippocampal volume; MD: Mean diffusivity; ME: Module eigengene; MoCA: Montreal Cognitive Assessment; RHV: Right hippocampal volume; WM: White matter volume.
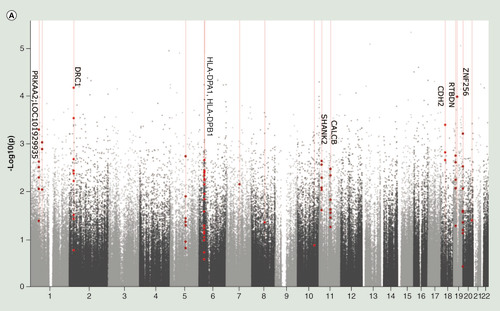
(A) Manhattan plot of differentially methylated regions (DMRs) associated with Montreal Cognitive Assessment. Red dots indicate the chromosomal location of individual probes within each DMR. The UCSC gene symbols corresponding to DMRs with more than three probes after Sidak correction for multiple testing are assigned to the chromosomal locations. (B) Heatmap of module–trait correlations for the remaining 24 modules, after excluding modules with significant association with the covariates of cell composition, batch, age, gender, smoking and IQ. Shown are the correlations of Montreal Cognitive Assessment, total brain volume, left hippocampal volume, right hippocampal volume, cerebrospinal fluid volume, white matter volume, gray matter volume, fractional anisotropy, mean diffusivity and white matter hyperintensities with each module. For each module–trait pair the upper value is the Pearson correlation coefficient, while the lower (bracketed) value is the correlation p-value. The cell color represents the strength and direction of the correlation. Modules are assigned an arbitrary color by the analysis software according to their size. (C) The correlation between module membership and gene significance for each probe in the ‘yellowgreen’ module.
CSF: Cerebrospinal fluid volume; FA: Fractional anisotropy; GM: Grey matter volume; LHV: Left hippocampal volume; MD: Mean diffusivity; ME: Module eigengene; MoCA: Montreal Cognitive Assessment; RHV: Right hippocampal volume; WM: White matter volume.