Figures & data
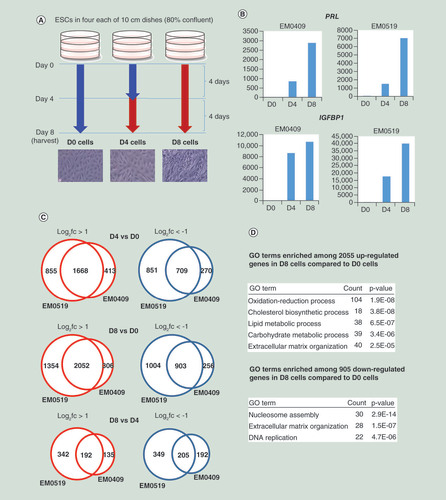
(A) Cell culture scheme for in vitro decidualization. Detailed procedures are described in the ‘Materials & methods’ section. Blue and red arrows indicate the periods of cell culture with cell maintenance medium and differentiation medium, respectively. Microscopic photographs (×200) of cells are shown. (B) Series of cells (D0, D4 and D8) from two donors (EM0409 and EM0519) were assessed for the expression levels of PRL and IGFBP1 upon decidualization (D4 and D8) relative to those in control D0 cells by quantitative RT-PCR (one point measurement per sample). (C) Numbers of differentially expressed genes upon decidualization. (D) Representative GO terms enriched in up- and downregulated genes upon decidualization.
GO: Gene ontology.
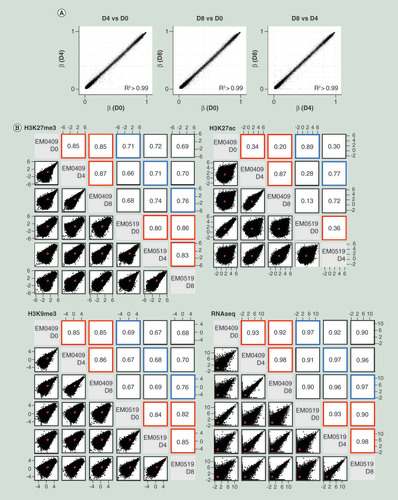
(A) Comparisons of genome-wide DNA methylation profiles among D0, D4 and D8 cells from the EM0409 donor. (B) Scatter plots and Pearson correlation coefficients for genome-wide histone modification profiles (H3K27me3, H3K27ac, and H3K9me3) and transcriptome (RNA-seq) profiles. Comparisons were made for all possible pairwise combination among five (H3K27ac) or six samples. Normalized mapped read counts per 1000-bp window for H3K9me3 and H3K27me3, normalized mapped read counts per peak for H3K27ac, and FPKM values for RNA-seq were plotted and assessed for their correlation using the pairs.panels function in the psych package of R. The correlation ellipse is shown in red in each plot. Correlation coefficients from the comparison of the same cell type between donors are boxed in blue, those from the comparison of different cell types (D0, D4 or D8) derived from the same donor are boxed in red.
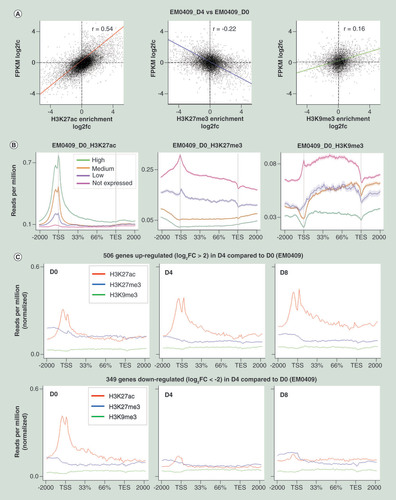
(A) Correlation analyses of GE changes (log2 fold-change (fc) of FPKM values) and HM changes (log 2 fc of enrichment scores) at the gene promoter regions (-2000 to 0 bp regions relative to TSS) in D4 cells compared with D0 cells for H3K27ac (left), H3K27me3 (middle), and H3K9me3 (right). The numbers of TSSs subjected to the correlation analysis were, 17,462, 11,162 and 6250 among 23,553 TSSs. (B) Average profiles of three histone modifications along gene structure drawn using the ngs.plot software package for four gene groups categorized by GE levels (no, low, middle and high). (C) Average profiles of three histone modifications along the structures of up- and downregulated genes in D0, D4 and D8 cells of EM0409. In panels (B) and (C), 2000 bp upstream, gene body (from TSS to transcription end site), and 2000 bp downstream regions were subjected to count reads. and the averages of the reads per million values of genes were plotted for 101 subwindows.
GE: Gene expression; HM: Histone modification; TSS: Transcription start site.
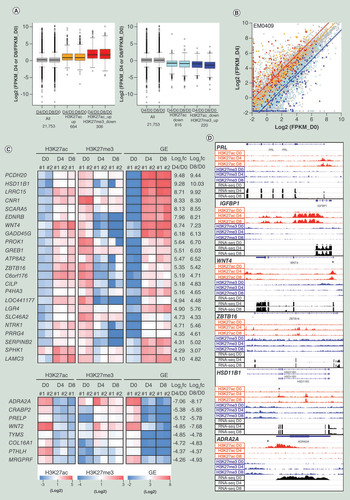
(A) Box plot representation of gene expression fold-changes of all 21,753 TSSs, TSSs accompanied with H3K27ac change only (orange and light blue), and TSSs accompanied with reciprocal changes of H3K27ac and H3K27me3 in EM0409 cell series (red and blue). The 21,753 TSSs were selected as those whose FPKM value is greater than 0.3 in one or more of three cell types (D0, D4 and D8). (B) Scatter-plot representation of log2-transformed FPKM values in EM0409_D0 (x-axis) and EM0409_D4 (y-axis) cells. The color assignment for dots and lines is the same as that in panel A. Lines represent the median of log2-transformed FPKM fold-changes of each of subcategories. (C) Heatmap representation of the H3K27ac and H3K27me3 enrichment levels of 23 upregulated and 8 downregulated promoters accompanied with reciprocal changes of H3K27ac and H3K27me3. These were selected as those fulfilling the FPKM log2 fold-change criteria of >4 or <-4. #1 and #2 correspond to EM0409 and EM0519. The heatmap color scales are shown at the bottom. (D) Visualization of histone modification and gene expression alterations for six loci. Read count (per 25bp-window) data (in .tdf format) were created using the count function of IGVtools (https://software.broadinstitute.org/software/igv/igvtools) from the mapped results of ChIP-seq and RNA-seq data (.bam files), and visualized using the Integrative Genomics Viewer (http://software.broadinstitute.org/software/igv/). The asterisk in the panels for WNT4, ZBTB16, HSD11B1 and ADRA2A indicates the approximate position of the genomic interval showing reciprocal changes of H3K27ac and H3K27me3 upon decidualization.
TSS: Transcription start site.