
Figures & data
Table 1. Clinical description of cohort.
Table 2. Oligonucleotide sequences.
Table 3. Differentially methylated probes identified by Minfi.
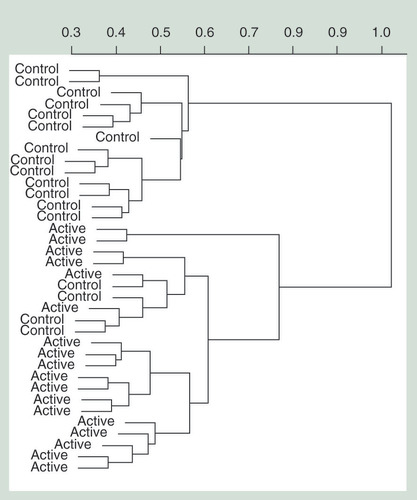
Hierarchical clustering performed using the top 100 most significant probes (Supplementary Table 3). The change in relative methylation values (β) is represented on the y-axis and individuals from each treatment are represented on the x-axis.
Change in methylation values is represented on the y-axis, in each instance the boxplot on the left represents the control group and the boxplot on the right represents the treatment group. (A) Chr1:204985932; (B) Chr3:183913285; (C) Chr8:25829073; (D) Chr11: 16430764; (E) Chr17: 39120012; (F) Chr10:8092775.
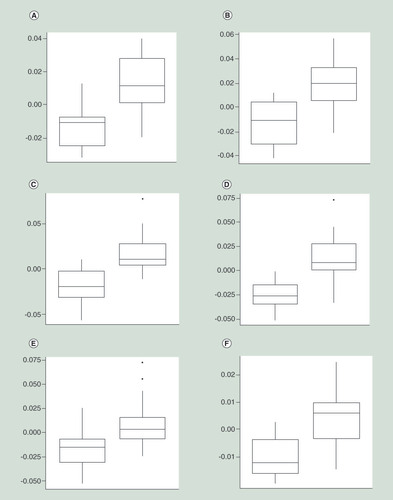
Table 4. Differentially methylated regions.
Table 5. Comparison of the MTHFR genotype frequencies observed in our attention-deficit/hyperactivity disorder study sample, with the wider population of similar descent.
Table 6. Significant differentially methylated regions.
Table 7. 10 most significant probes with respect to A1298C* and C677T genotypes.
Table 8. KEGG gene pathway analysis of top 100 probes demonstrating differential methylation.
Supplemental material