Figures & data
Table 1. Principal characteristics of the patients included in the study. Diabetes but no neuropathy (G3), diabetes with neuropathy (G2) and diabetes with both neuropathy and Charcot foot (G1). Data are represented as mean (SD) or number (%).
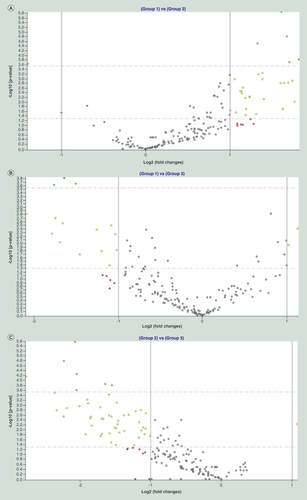
Volcano plots showing differentially expressed miRNAs in the following comparisons: T2D with Charcot foot over T2D with neuropathy (Group 1 vs Group 2) (A); T2D with Charcot foot over T2D without neuropathy (Group 1 vs Group 3) (B); and T2D with neuropathy over T2D without neuropathy (Group 2 vs Group 3) (C). miRNAs with more than twofold change and a significant p-value after applying Bonferroni correction are shown in green. Those, which show more than twofold change but whose p-value significance is achieved by discounting Bonferroni correction are shown in yellow. Gray dots represent miRNAs exhibiting less than twofold change, while red dots stand for those showing more than twofold change but lacking statistical significance. Solid vertical lines indicate twofold upregulation or downregulation on the log scale. Dashed horizontal lines either mark p-value = 0.05 on the log scale (red line), or Bonferroni-corrected p-value cut-off (green line).
T2D: Type 2 diabetes.
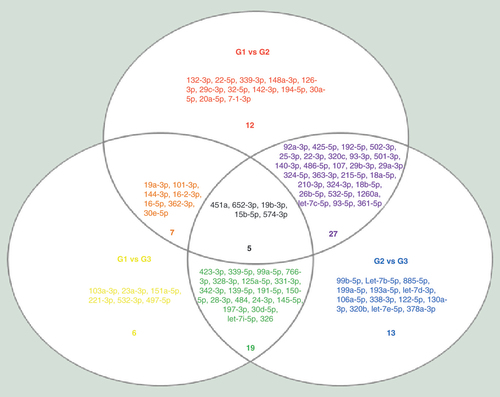
A three-way Venn diagram representing the apparition of miRNAs in each comparison. The one in the center (black) appears in every contrast, the one at the merging of two circles (orange, purple, green) appears in two comparisons and the one in once circle only (yellow, red, blue) appears in only one set of data.
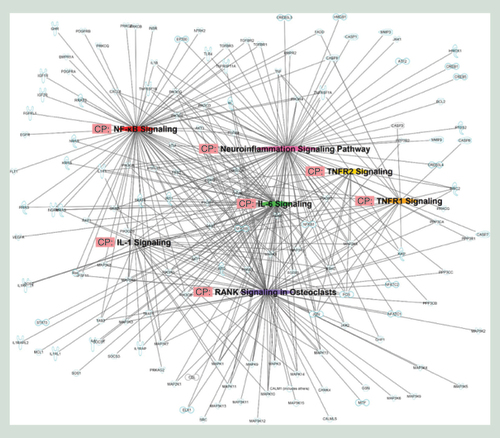
The networks hypothesized by Ingenuity Pathway Analysis are based on the molecular relationships, interactions and pathway associations between the methylated candidate genes as shown in a graphical representation.
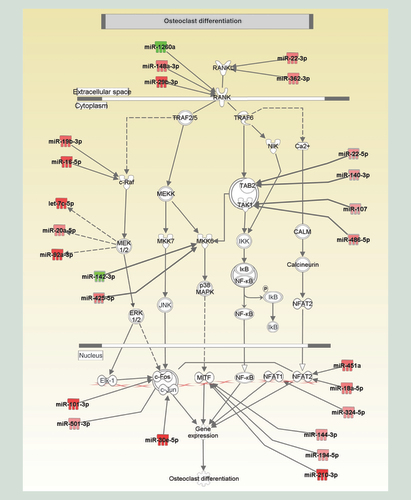
The graphical representation had been generated by Ingenuity Pathway Analysis and reflects the molecular relationships between miRNAs and candidate genes. miRNAs in red were overexpressed in Charcot foot (CF) patients as compared with Type 2 diabetes (T2D) patients with neuropathy, while the ones in green were downexpressed in CF patients compared with T2D patients with neuropathy.