Figures & data
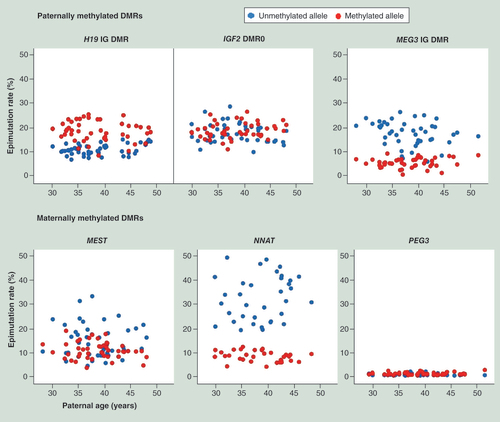
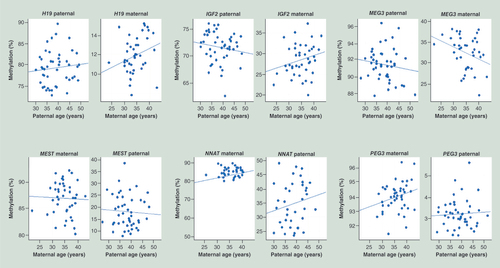
The upper panel shows three paternally imprinted/methylated (H19 IG DMR, IGF2 DMR0 and MEG3 IG DMR) regions and the lower panel shows three maternally imprinted/methylated (MEST, NNAT and PEG3) amplicons. Each dot represents an informative FCB sample. Regression lines indicate the direction of age-related changes.
FCB: Fetal cord blood; IG DMR: Intergenic differentially methylated region.
The left diagram shows identical BMI effects on paternal allele methylation in female and male FCBs. The right diagram displays the impact of the underlying genetic variation (A vs G SNP) on paternal MEST methylation.
FCB: Fetal cord blood.
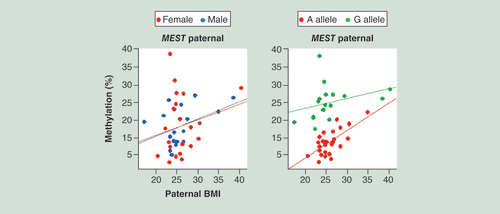
Table 1. SNP haplotype effects on the allele-specific methylation of imprinted genes.
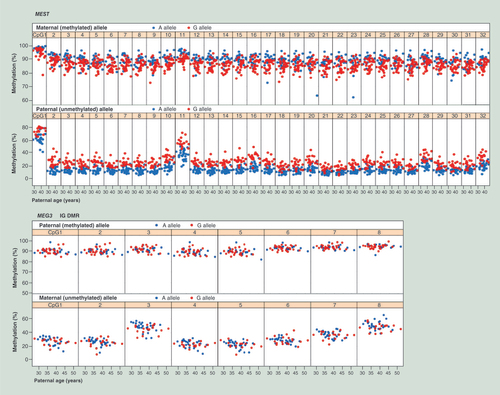
For each gene, the upper panel shows single CpG methylation levels of the methylated allele and the lower panel of the unmethylated allele. A (Adenine) alleles are indicated by blue and G (Guanine) alleles by red dots. All 32 CpGs in the MEST target region display a clear SNP effect. Maternally methylated A alleles consistently show a higher methylation than maternally methylated G alleles, whereas paternally unmethylated A alleles show a lower methylation than paternally unmethylated G alleles. In contrast, none of the 8 targeted CpGs in the MEG3 IG DMR displays a clear SNP effect.
IG DMR: Intergenic differentially methylated region; SNP: Single nucleotide polymorphism.
Blue and red dots indicate the epimutation rates on the unmethylated and methylated alleles, respectively, for a given gene and sample.